At the time of this experiment, Udacity courses currently have two options on the home page: “start free trial”, and “access course materials”. If the student clicks “start free trial”, they will be asked to enter their credit card information, and then they will be enrolled in a free trial for the paid version of the course. After 14 days, they will automatically be charged unless they cancel first. If the student clicks “access course materials”, they will be able to view the videos and take the quizzes for free, but they will not receive coaching support or a verified certificate, and they will not submit their final project for feedback.
In the experiment, Udacity tested a change where if the student clicked “start free trial”, they were asked how much time they had available to devote to the course. If the student indicated 5 or more hours per week, they would be taken through the checkout process as usual. If they indicated fewer than 5 hours per week, a message would appear indicating that Udacity courses usually require a greater time commitment for successful completion, and suggesting that the student might like to access the course materials for free. At this point, the student would have the option to continue enrolling in the free trial, or access the course materials for free instead. This screenshot shows what the experiment looks like.

This figure shows simple action diagram, blue boxes are original user actions and yellow box is experimental action.
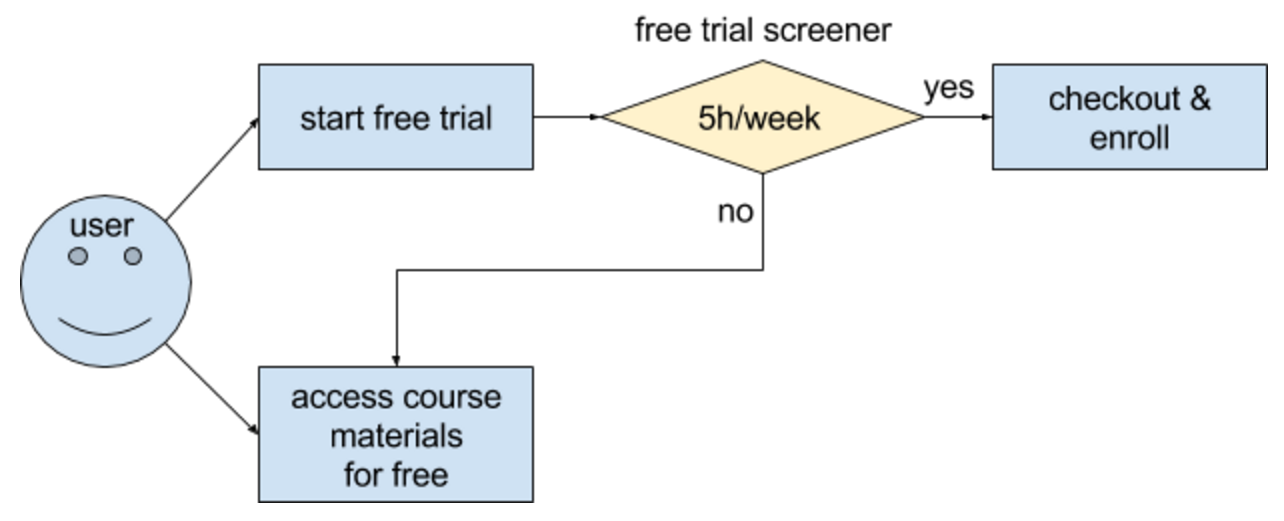
The hypothesis was that this might set clearer expectations for students upfront, thus reducing the number of frustrated students who left the free trial because they didn’t have enough time—without significantly reducing the number of students to continue past the free trial and eventually complete the course. If this hypothesis held true, Udacity could improve the overall student experience and improve coaches’ capacity to support students who are likely to complete the course.
Experiment Design
Metric Choice
Invariant Metrics: Number of cookies, Number of clicks, Click-through-probability
Evaluation Metrics: Gross conversion, Retention, Net conversion
For each metric, explain both why you did or did not use it as an invariant metric and why you did or did not use it as an evaluation metric.
Number of cookies: Good invariant metric because the number of users should not vary as we change “start free trial” option, because the users didn’t see it before.
Number of user-ids: Not a good invariant metric. Because this experiment might affect to enrollment, we could expect that control and experiment group have different value. Not a good evaluation metric because the number of enrolled users can vary with a particular day, which can affect to our examination on the effect of “start free trial” page experiment.
Number of clicks: Good invariant metric because the clicks happen before the user sees the experiment, and are thus independent from it. Not a good evaluation metric because it is not useful metric and other metrics contains this, such as gross conversion.
Click-through-probability: Good invariant metric because the clicks happen before the user sees the experiment, similar to number of cookies, and are thus it is not dependent on our experiment.
Gross conversion: Not a good invariant metric because number of enrolled users is affected by the experiment. Good evaluation metric because it is dependent to the experiment and shows whether we managed to decrease the cost of enrollments that are unlikely to become paying users.
Retention: Not a good invariant metric because the number of users who enrolled in free trial is dependent on the experiment. Good evaluation metric because it is dependent to the experiment, and shows the change of revenue.
Net conversion: Not a good invariant because the number of users who enrolled in free trial is dependent on the experiment. Good evaluation metric because it is dependent to the experiment, and shows the change of revenue.
Also, state what results you will look for in your evaluation metrics in order to launch the experiment.
Gross conversion will show us whether we lower our costs by introducing the screener, and Net conversion will show how the change affects our revenues.
Therefore, to launch the experiment, Gross conversion should have practically significant decrease, and Net conversion should have statistically significant increase.
Measuring Standard Deviation
For each of your evaluation metrics, indicate whether you think the analytic estimate would be comparable to the the empirical variability, or whether you expect them to be different (in which case it might be worth doing an empirical estimate if there is time). Briefly give your reasoning in each case.
Table 1: Standard deviation of evaluation metrics
| Standard Deviation | |
|---|---|
| Gross conversion | 0.0202 |
| Retention | 0.0549 |
| Net conversion | 0.0156 |
When Unit of Analysis and Unit of Diversion are same, variability tends to be lower and closer to analytical estimate. On the other hand, if Unit of Diversion and Unit of Analysis are different, the empirically computed variability will be much higher than the analytic estimate. Our Unit of Diversion is a cookie. Retention has “number of user-ids to complete checkout” as denominator, so it is better to move to empirically and analytically computed variability.
Gross and Net Conversion have “unique cookies to click the Start free trial button” as Unit of Analysis which is same with Unit of Diversion, so the analytic estimate of the variance can be used.
Sizing
Number of Samples vs. Power
I didn’t use the Bonferroni correction. I used online Sample Size Calculator to find out required number of pageviews for three evaluation metrics (alpha = 0.05 and beta = 0.2).
Click-through-probability on “Start free trial” is 0.08 which is used to calculate number of pageviews for Gross Conversion and Net Conversion. Number of pageviews for Retention is sample size divided by payment-probability of user 0.0165. Gross Conversion, Retention, Net Conversion are required 322,937.5, 2,370,606.061, and 342,622.5 pageviews, respectively.
Our plan is to compare two groups - experimental and control group, and to have enough power for each metric. So, the total number of pageviews required across both groups is two times largest value of pageviews. I removed Retention because it requires too many pageviews, so it needs up to 4 months to run the experiment, which is not practical in timely sense.
Thus, I concluded 685,325 pageviews is needed to power my experiment appropriately.
Duration vs. Exposure
Give your reasoning for the fraction you chose to divert. How risky do you think this experiment would be for Udacity?
If I selected 100% traffic to be diverted to this experiment to get enough pageviews as soon as possible. 50% of traffic will go to control group and experiment group. So, 18 days are enough for our experiment, which is a reasonable duration for our experiment.
I think Free Trial Screener test has low risk since it shows visible change affecting user behavior. This experiment might discourage new enrollment, and yet we can save the cost of enrollments that are unlikely to become paying users. Even if we end up not rolling out the experiment, effects on users would be not big. Also, if there is a chance of a negative impact on payment, extending the duration of the experiment would just mean losing the same customers in a longer amount of time. Regarding to data sensitivity, we do handle number of user visits or enrollment, but we don’t deal with sensitive or private data.
Sanity Checks
Table 2: Sanity checks
| CI lower | CI upper | Observed value | Sanity Check | |
|---|---|---|---|---|
| Number of cookies | 0.4988 | 0.5011 | 0.5006 | PASS |
| Number of clicks | 0.4958 | 0.5041 | 0.5004 | PASS |
| Click-through-probability | -0.0012 | 0.0012 | 0.0001 | PASS |
Each of invariant metrics had observed value in a range of their confidence interval, so all metric passed sanity check.
Result Analysis
Effect Size Tests
For each of your evaluation metrics, give a 95% confidence interval around the difference between the experiment and control groups. Indicate whether each metric is statistically and practically significant.
Table 3: Effect size of evaluation metrics
| CI lower | CI upper | practical significance difference | |
|---|---|---|---|
| Gross conversion | -0.0291 | -0.012 | 0.01 |
| Net conversion | -0.0116 | 0.0018 | 0.0075 |
Since the confidence interval of Gross conversion does not include zero, it is statistically significant. That means, it’s likely that there is real difference. The confidence interval does not include practical significance boundary(dmin=0.01). Therefore, Gross conversion is practically significant, meaning that I can be confident at the 95% level that the size of this effect is something that I care about.
Net conversion is neither statistically significant nor practically significant. Its confidence interval include zero, so it’s unlikely that there is real difference. It also include practical significance boundary(dmin=0.0075), because practical significance difference does not include the sign of the effect, in this case, we consider negative changes. Thus, I can not be confident at the 95% level that the size of this effect is something that I care about.
Sign Tests
For each of your evaluation metrics, do a sign test using the day-by-day data, and report the p-value of the sign test and whether the result is statistically significant.
Table 4: Sign tests for evaluation metrics
| p-value | Number of successes | Number of experiment | |
|---|---|---|---|
| Gross conversion | 0.002 | 4 | 23 |
| Net conversion | 0.6776 | 10 | 23 |
Gross conversion is statistically significant, since this is less than the chosen alpha of 0.05. The sign test agrees the hypothesis test, that this result is unlikely to come about by chance.
However, Net conversion is not statistically significant, because it is larger than alpha of 0.05. The sign test does not agree the hypothesis test, that means this result is likely to happen by chance.
Summary
State whether you used the Bonferroni correction, and explain why or why not. **If there are any discrepancies between the effect size hypothesis tests and the sign tests, describe the discrepancy and why you think it arose.
I did not use a Bonferroni correction because we are only testing one variation.
In order to launch, we would need them both to match our expectations: we look for a decrease in Gross conversion and for a no decrease in Net conversion. Among two metrics, Gross conversion match match our expectations and Net conversion does not. Then we need to use Bonferroni correction to avoid Type I error. However, I did not use a Bonferroni correction because the metrics have high correlation and the Bonferroni correction will be too conservative to this case.
There is no discrepancies between the effect size hypothesis tests and the sign tests.
Recommendation
Make a recommendation and briefly describe your reasoning.
My evaluation metrics are Gross conversion and Net conversion.
Gross conversion is negative and practically significant in our experiment, this means good sign to Audacity. Screening helps Audacity to reduce costs on trial signups that are likely to drop out. However, Net conversion turned out statistically and practically insignificant and the confidence interval includes negative values. This means free trial screener might not increase number of paid users, so it might decrease Audacity’s revenue.
Based on this results, I would recommend not launching the “5 or more hour” recommendations to “start free trial” button. Instead, I would consider other ways to screen early leavers.
Follow-Up Experiment
Give a high-level description of the follow up experiment you would run, what your hypothesis would be, what metrics you would want to measure, what your unit of diversion would be, and your reasoning for these choices.
Add an “enroll with your friend” feature after “start free trial” button clicks, and send messages about friend’s study timeline. This feature will allow user to study persistently with their studymate. This feature will be potentially compelling to users who want to take the course but not sure about completing whole courses. Those users will stay longer with their studymate who joined together.
I have hypothesis: 1) The null hypothesis is that by providing this feature, the number of early cancellation will be increased or same. 2) The alternative hypothesis is that by providing this additional option, the number of early cancellations will be decreased, because those who enrolled with their friend are likely to maintain their subscription.
New free trial signups will randomly be assigned to control and experiment group. The control group will be same as before this experiment. The users of experiment group will invite friend. We could give them financial incentives for inviting friend. Then, the users will get messages about their friend’s status.
The initial unit of diversion will be the user-id, as we measure signed-in user’s behavior which is more stable than a cookies.
The invariant metric is number of user-ids, because the users sign up for for free trial before they invite their friend and are exposed to friend’s study timeline.
The evaluation metric is retention - this will test whether the additional option prevent early cancellations. If it positive and practically significant, early cancellation would be reduced.
If experiment result match our expectation, I would recommend to launch this feature.