I used R and 20applied exploratory data analysis techniques to explore relationships in one variable to multiple variables and to explore a white wine dataset for distributions, outliers, and anomalies.
Overview
- Prerequisite
- Univariate Analysis
- Bivariate Analysis
- Multivariate Analysis
- Final Plots and Summary
- Reflection
Prerequisite
I installed scales, memisc, ggplot2, psych, gridExtra, and loaded wine quality dataset.
Univariate Analysis
What is the structure of your dataset?
Number of rows, Number of columns
[1] 4898 13
Summary of dataset
##  [1] "X"                    "fixed.acidity"        "volatile.acidity"
##  [4] "citric.acid"          "residual.sugar"       "chlorides"
##  [7] "free.sulfur.dioxide"  "total.sulfur.dioxide" "density"
## [10] "pH"                   "sulphates"            "alcohol"
## [13] "quality"

##        X        fixed.acidity    volatile.acidity  citric.acid
##  Min.   :   1   Min.   : 3.800   Min.   :0.0800   Min.   :0.0000
##  1st Qu.:1225   1st Qu.: 6.300   1st Qu.:0.2100   1st Qu.:0.2700
##  Median :2450   Median : 6.800   Median :0.2600   Median :0.3200
##  Mean   :2450   Mean   : 6.855   Mean   :0.2782   Mean   :0.3342
##  3rd Qu.:3674   3rd Qu.: 7.300   3rd Qu.:0.3200   3rd Qu.:0.3900
##  Max.   :4898   Max.   :14.200   Max.   :1.1000   Max.   :1.6600
##  residual.sugar     chlorides       free.sulfur.dioxide
##  Min.   : 0.600   Min.   :0.00900   Min.   :  2.00
##  1st Qu.: 1.700   1st Qu.:0.03600   1st Qu.: 23.00
##  Median : 5.200   Median :0.04300   Median : 34.00
##  Mean   : 6.391   Mean   :0.04577   Mean   : 35.31
##  3rd Qu.: 9.900   3rd Qu.:0.05000   3rd Qu.: 46.00
##  Max.   :65.800   Max.   :0.34600   Max.   :289.00
##  total.sulfur.dioxide    density             pH          sulphates
##  Min.   :  9.0        Min.   :0.9871   Min.   :2.720   Min.   :0.2200
##  1st Qu.:108.0        1st Qu.:0.9917   1st Qu.:3.090   1st Qu.:0.4100
##  Median :134.0        Median :0.9937   Median :3.180   Median :0.4700
##  Mean   :138.4        Mean   :0.9940   Mean   :3.188   Mean   :0.4898
##  3rd Qu.:167.0        3rd Qu.:0.9961   3rd Qu.:3.280   3rd Qu.:0.5500
##  Max.   :440.0        Max.   :1.0390   Max.   :3.820   Max.   :1.0800
##     alcohol         quality
##  Min.   : 8.00   Min.   :3.000
##  1st Qu.: 9.50   1st Qu.:5.000
##  Median :10.40   Median :6.000
##  Mean   :10.51   Mean   :5.878
##  3rd Qu.:11.40   3rd Qu.:6.000
##  Max.   :14.20   Max.   :9.000
White wine dataset has 12 variables that include physicochemical factors and sensory data. Most white wines are 6 grade. Feature of the widest range is total sulfur dioxide, and the smallest range is density.
What is/are the main feature(s) of interest in your dataset?
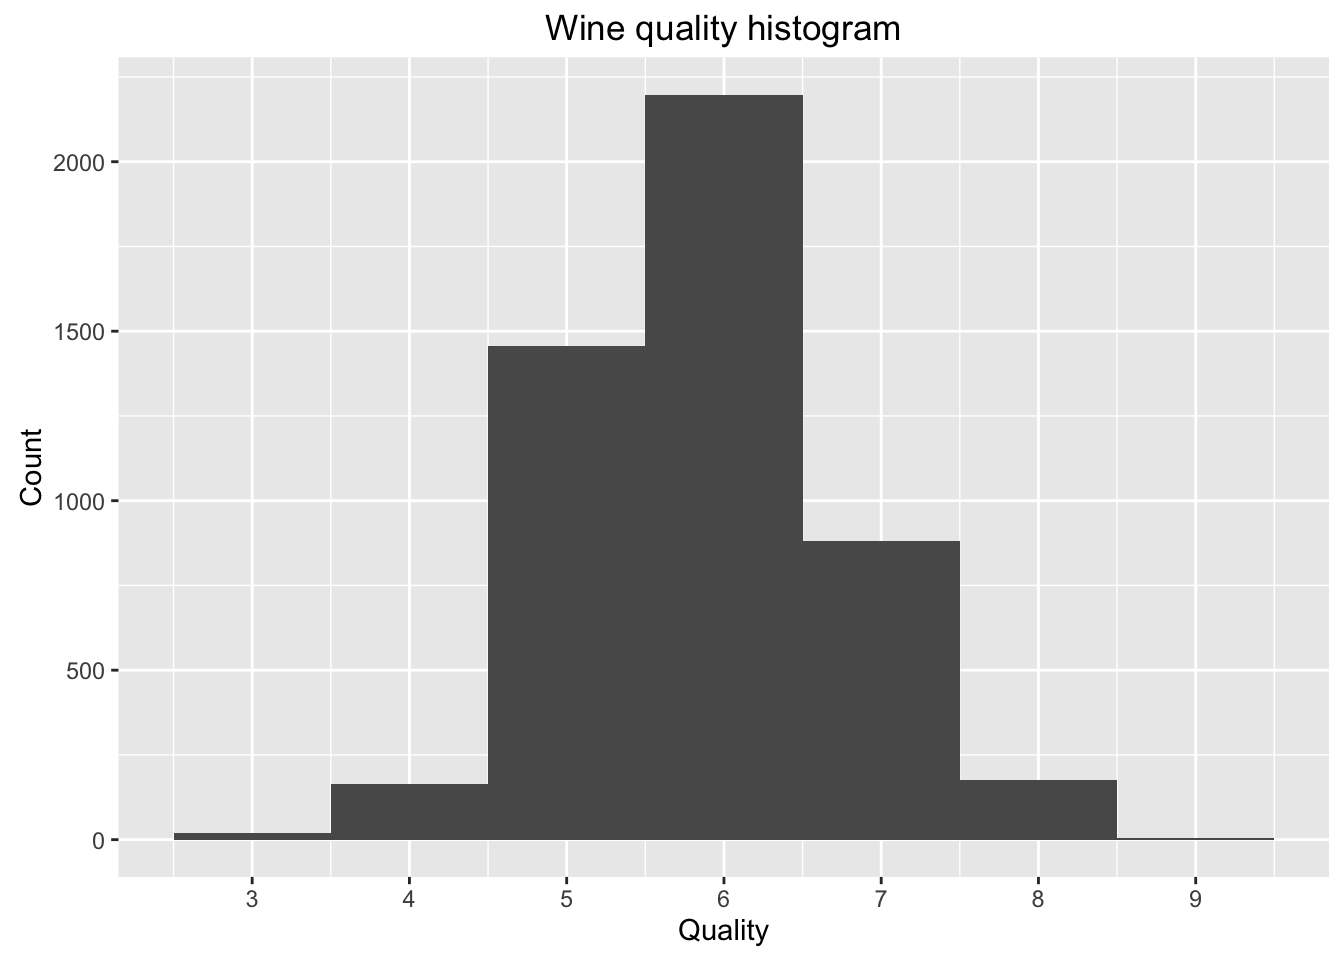
The most interesting feature is quality, because it tells about which wine is bad or excellent. The quality is normal distribution as shown in histogram.

What other features in the dataset do you think will help support your investigation into your feature(s) of interest?
Wine experts use their senses to taste wines: sight, smell, taste. Physicochemical properties of wine indicate a specific sensory data. For example, residual sugar make a sweetness, citric acid is related to a freshness, and acid or tannin make an astringent taste. So, I’m interested in citric acid, residual sugar, and fixed acidity. Alcohol is also considered.
Citric acid
##    Min. 1st Qu.  Median    Mean 3rd Qu.    Max.
##  0.0000  0.2700  0.3200  0.3342  0.3900  1.6600
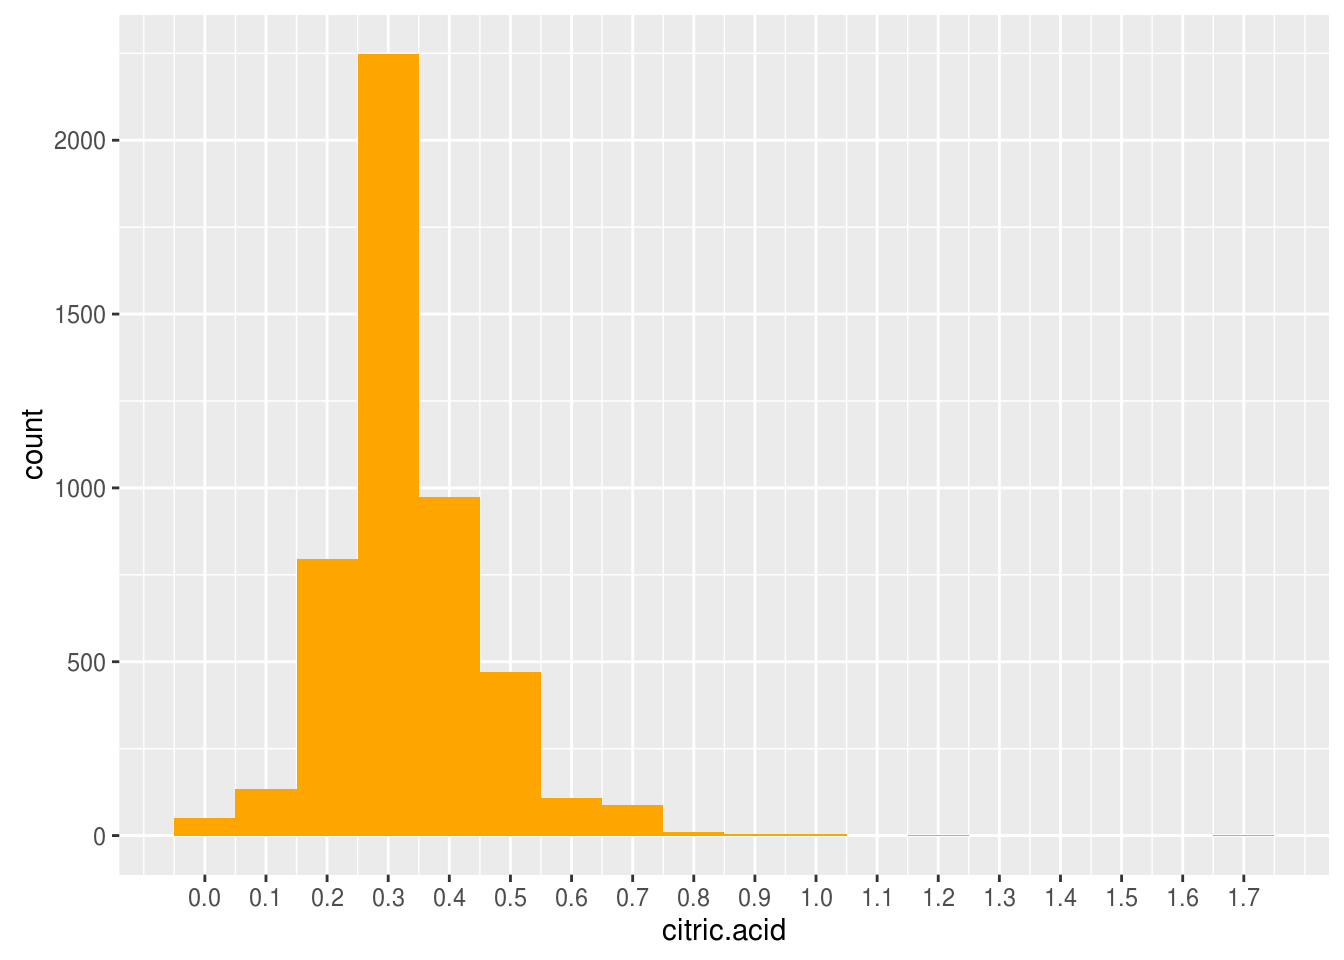
Citric acid distribution looks normal distribution. Most of white wines have 0.3 (g/dm^3) of citric acid. There is outlier of 1.7 (g/dm^3) of citric acid.
Fixed acidity
##    Min. 1st Qu.  Median    Mean 3rd Qu.    Max.
##   3.800   6.300   6.800   6.855   7.300  14.200
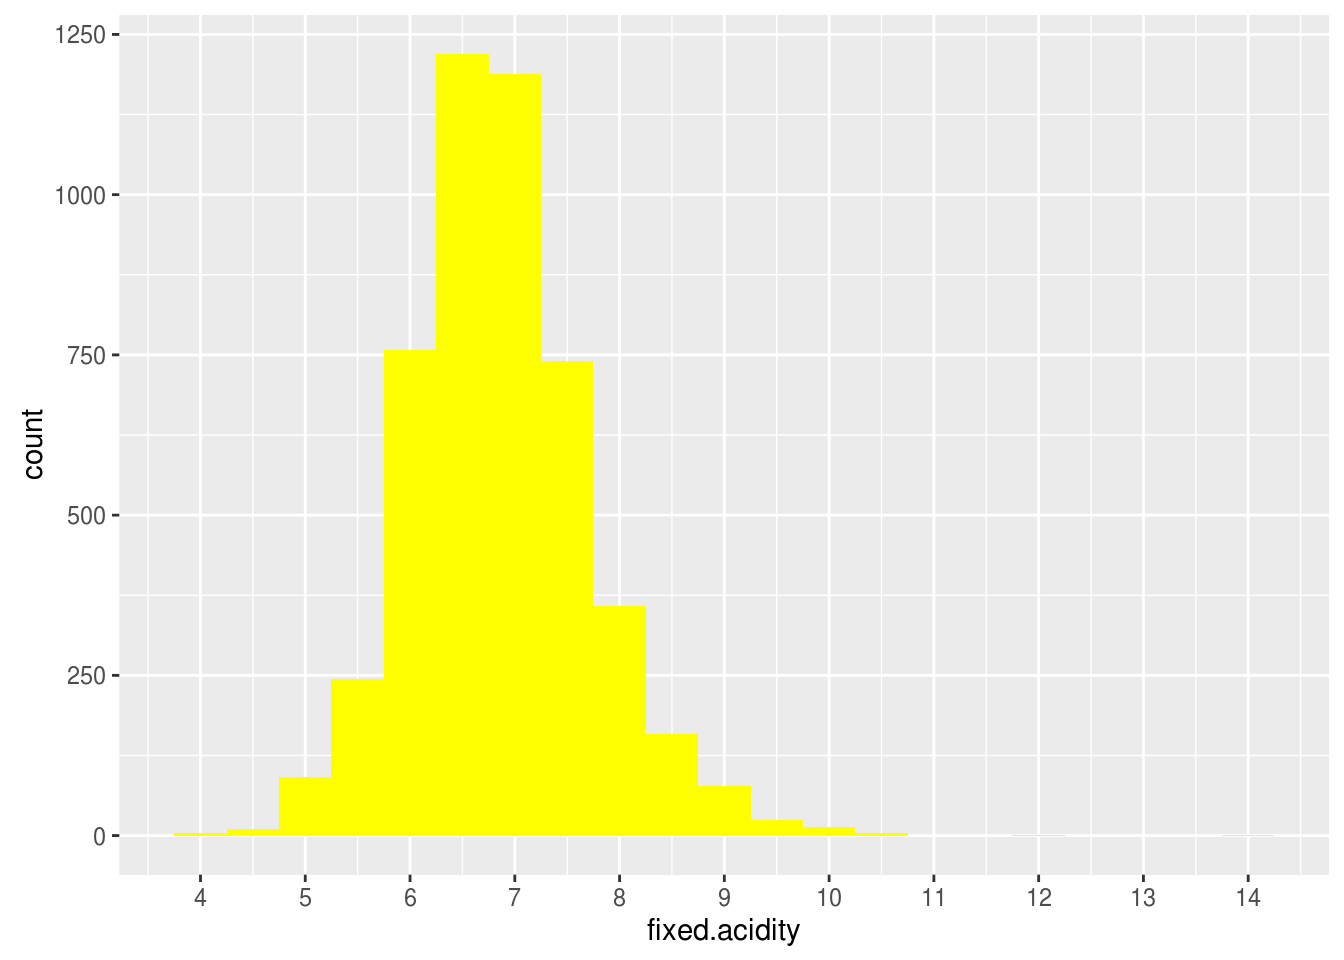
Fixed acidity distribution seems normal distribution. Most of white wines have 6~7 (g/dm^3) of fixed acidity. There is outlier of 14.2 (g/dm^3).
Residual sugar
##    Min. 1st Qu.  Median    Mean 3rd Qu.    Max.
##   0.600   1.700   5.200   6.391   9.900  65.800
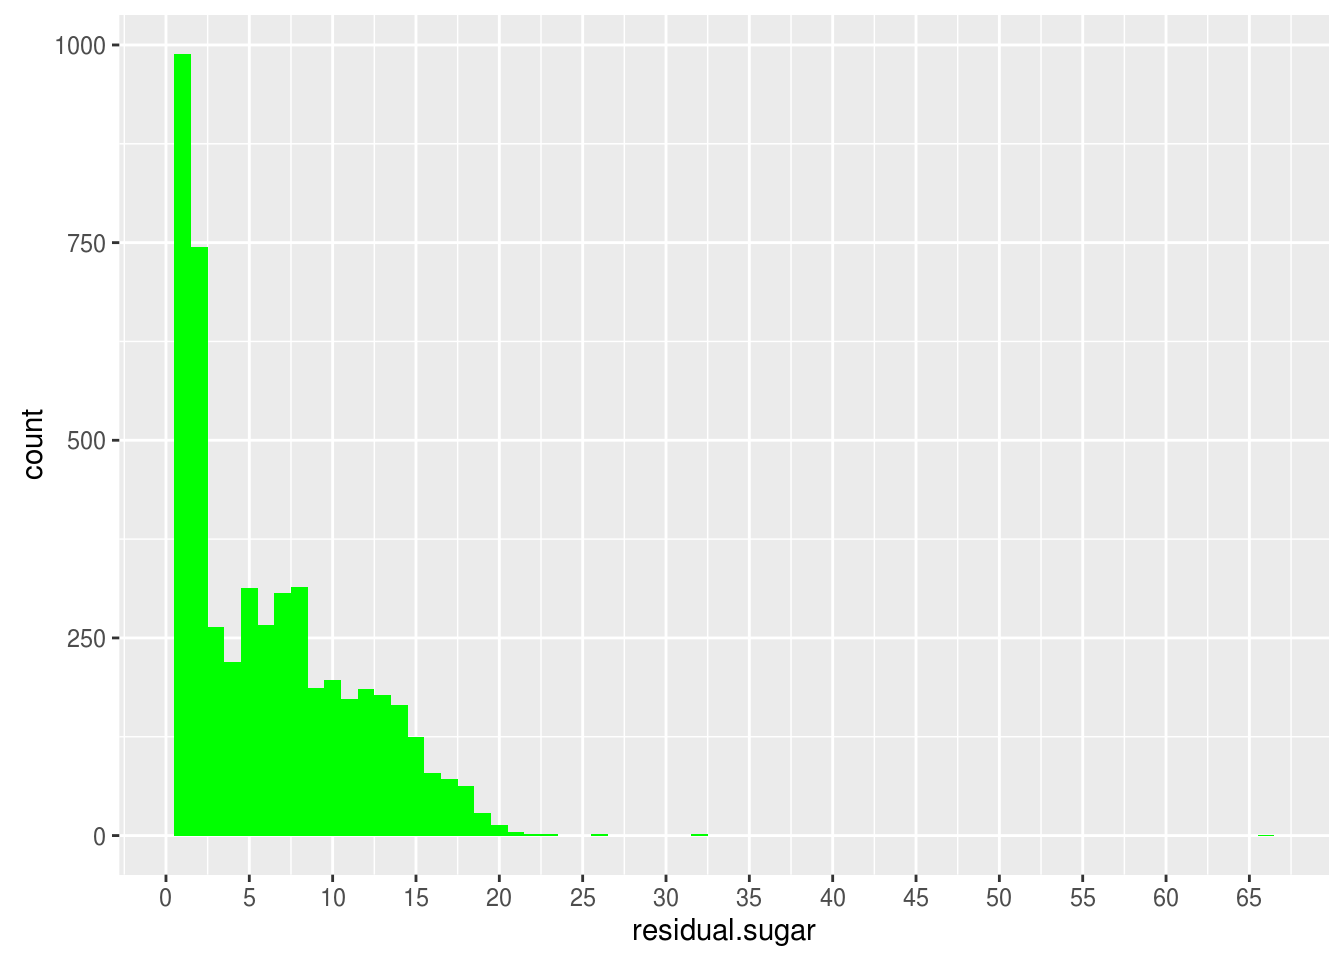
Residual sugar distribution looks skewed. The largest spikes in the 1~2 (g/dm^3). There are very few wines Since there is outlier of 65.8 (g/dm^3) and dataset shows very sweet wine is rare, I plot without top 1% of residual sugar.
Alcohol
##    Min. 1st Qu.  Median    Mean 3rd Qu.    Max.
##    8.00    9.50   10.40   10.51   11.40   14.20
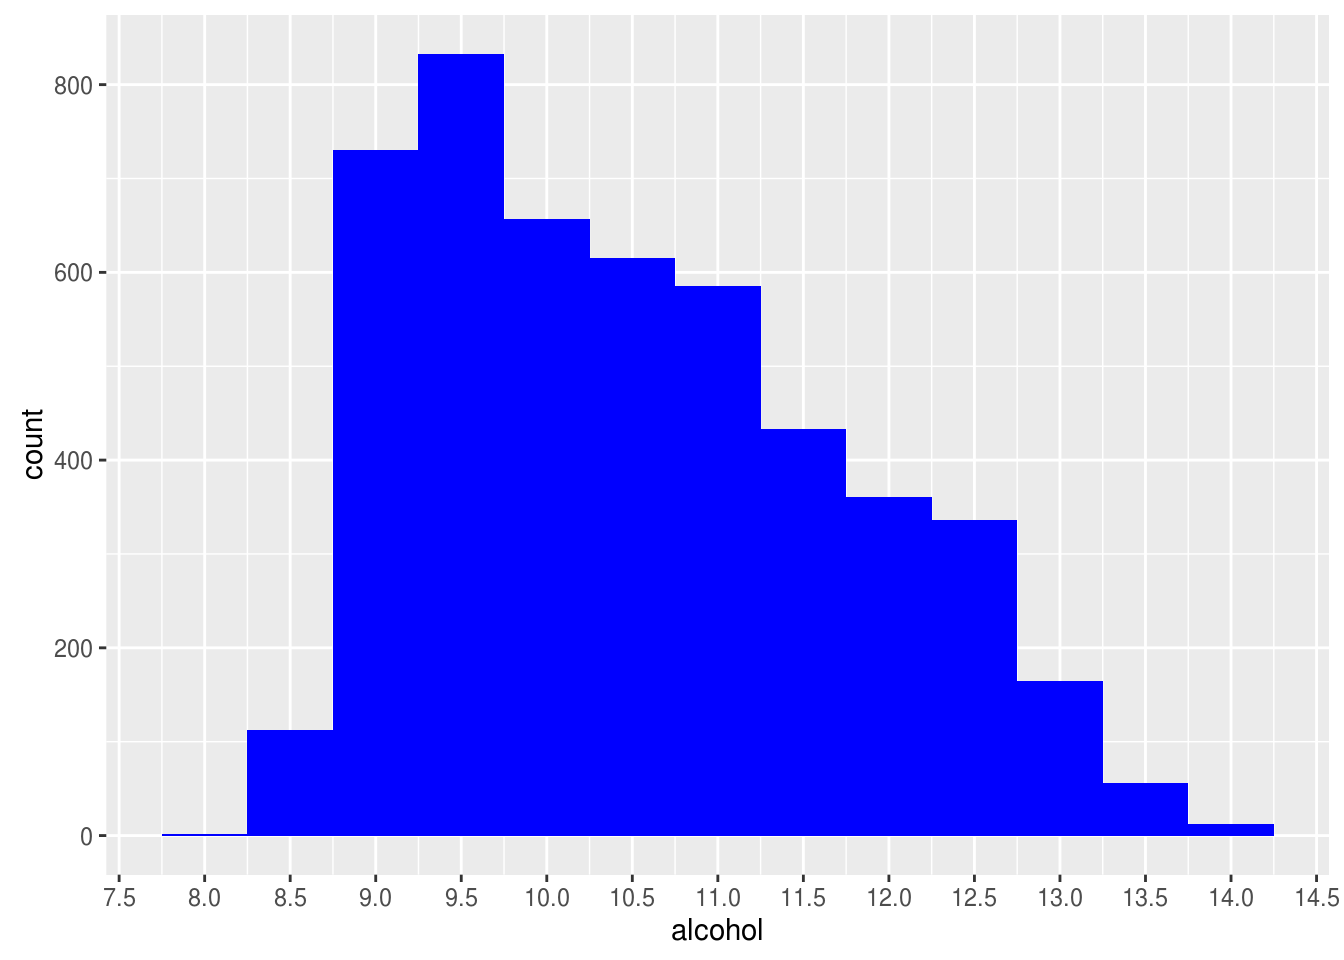
Alcohol seems skewed. Most white wines are 9.5% alcohol.
Density
##    Min. 1st Qu.  Median    Mean 3rd Qu.    Max.
##  0.9871  0.9917  0.9937  0.9940  0.9961  1.0390
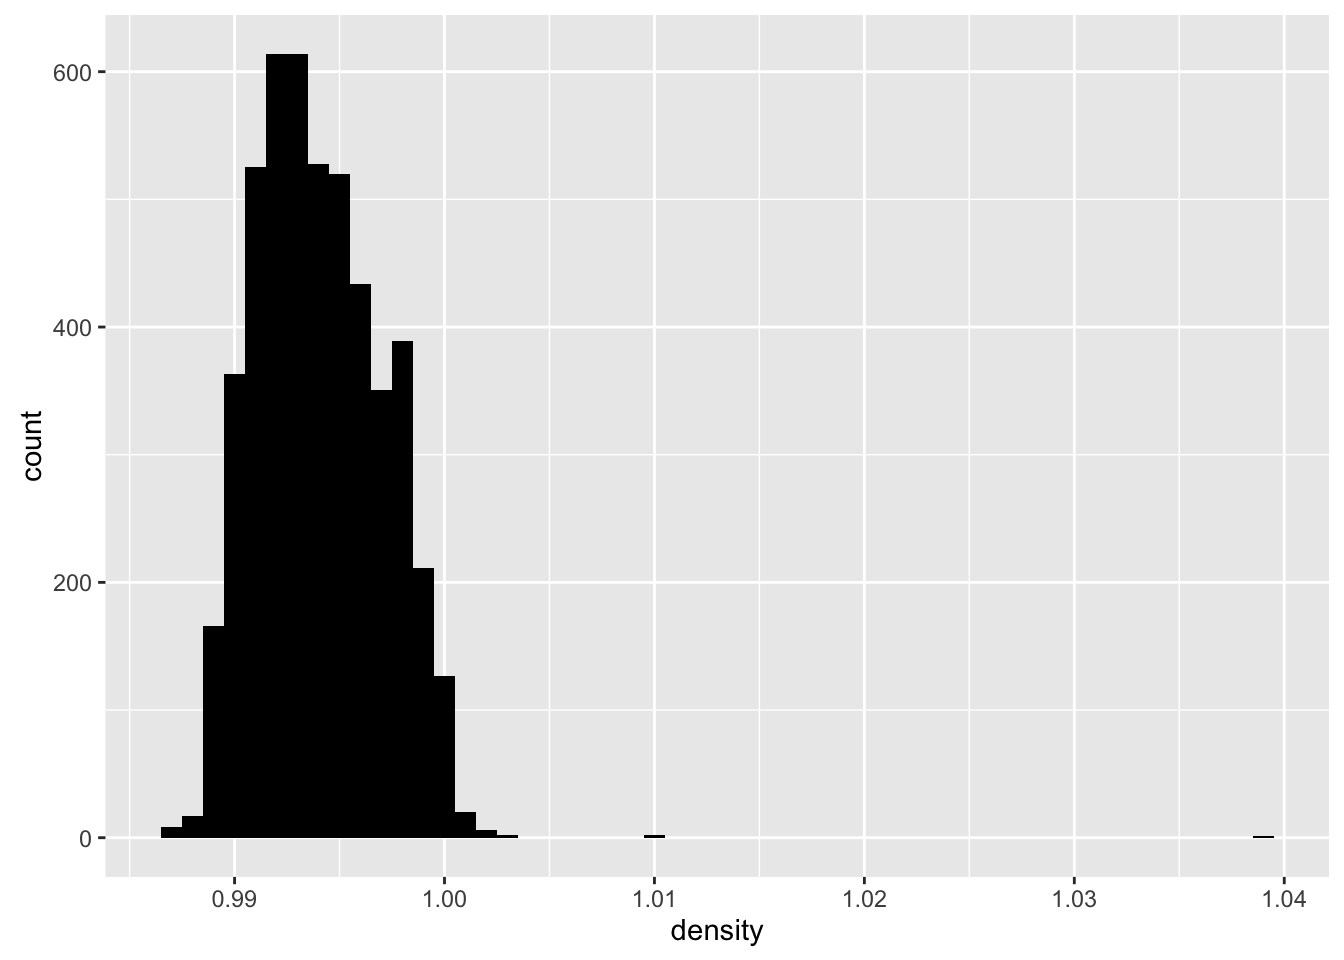
Density seems normal distribution. Most white wines are 0.99 density. But there are couple of outliers.
Volatile acidity
##    Min. 1st Qu.  Median    Mean 3rd Qu.    Max.
##  0.0800  0.2100  0.2600  0.2782  0.3200  1.1000
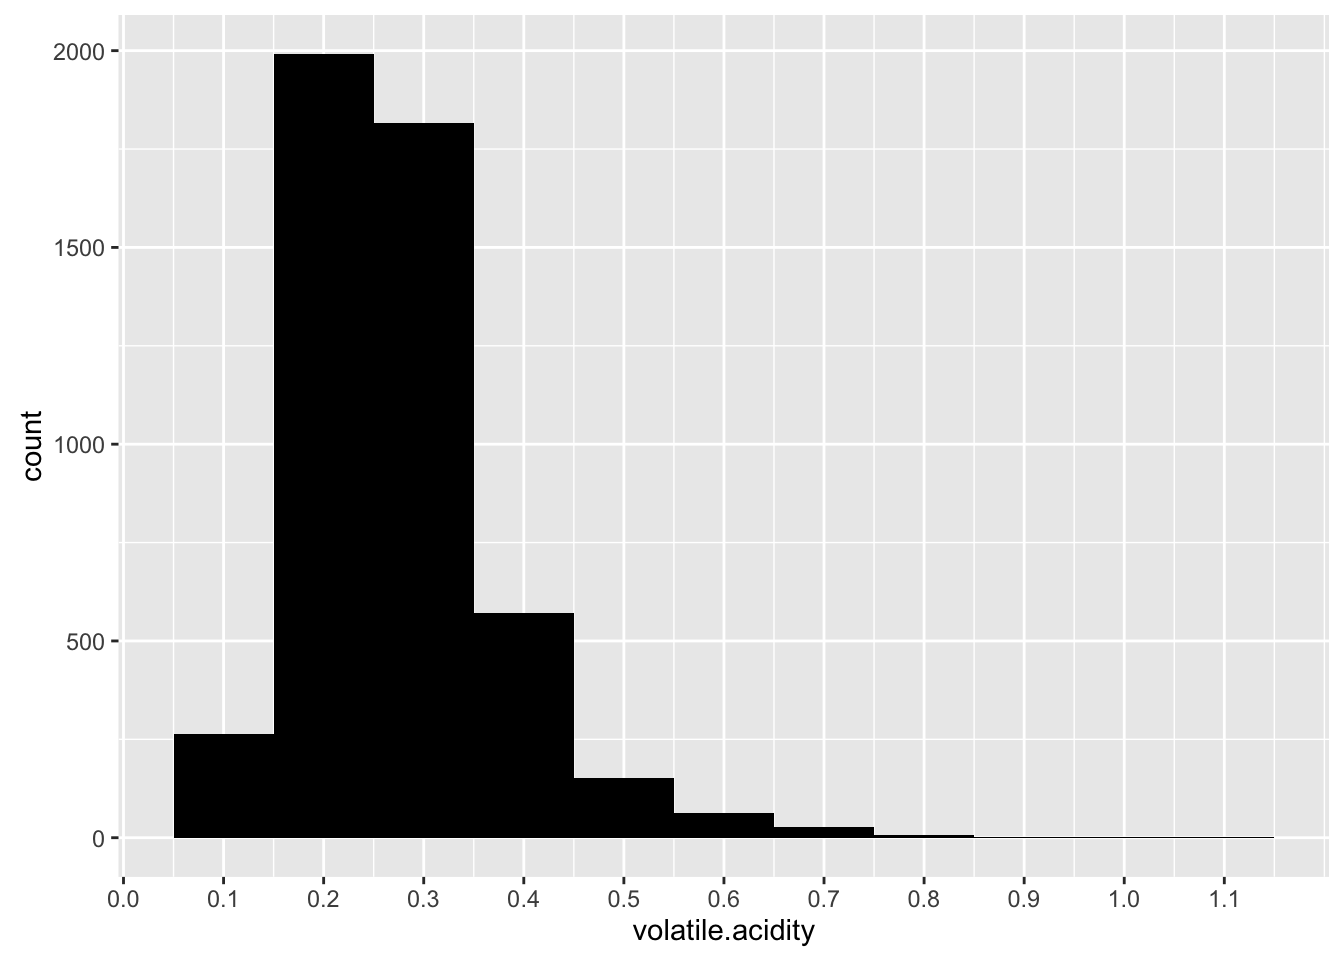
Volatile acidity seems normal distribution. Most white wines are 0.2 acidity.
Chlorides
##    Min. 1st Qu.  Median    Mean 3rd Qu.    Max.
## 0.00900 0.03600 0.04300 0.04577 0.05000 0.34600
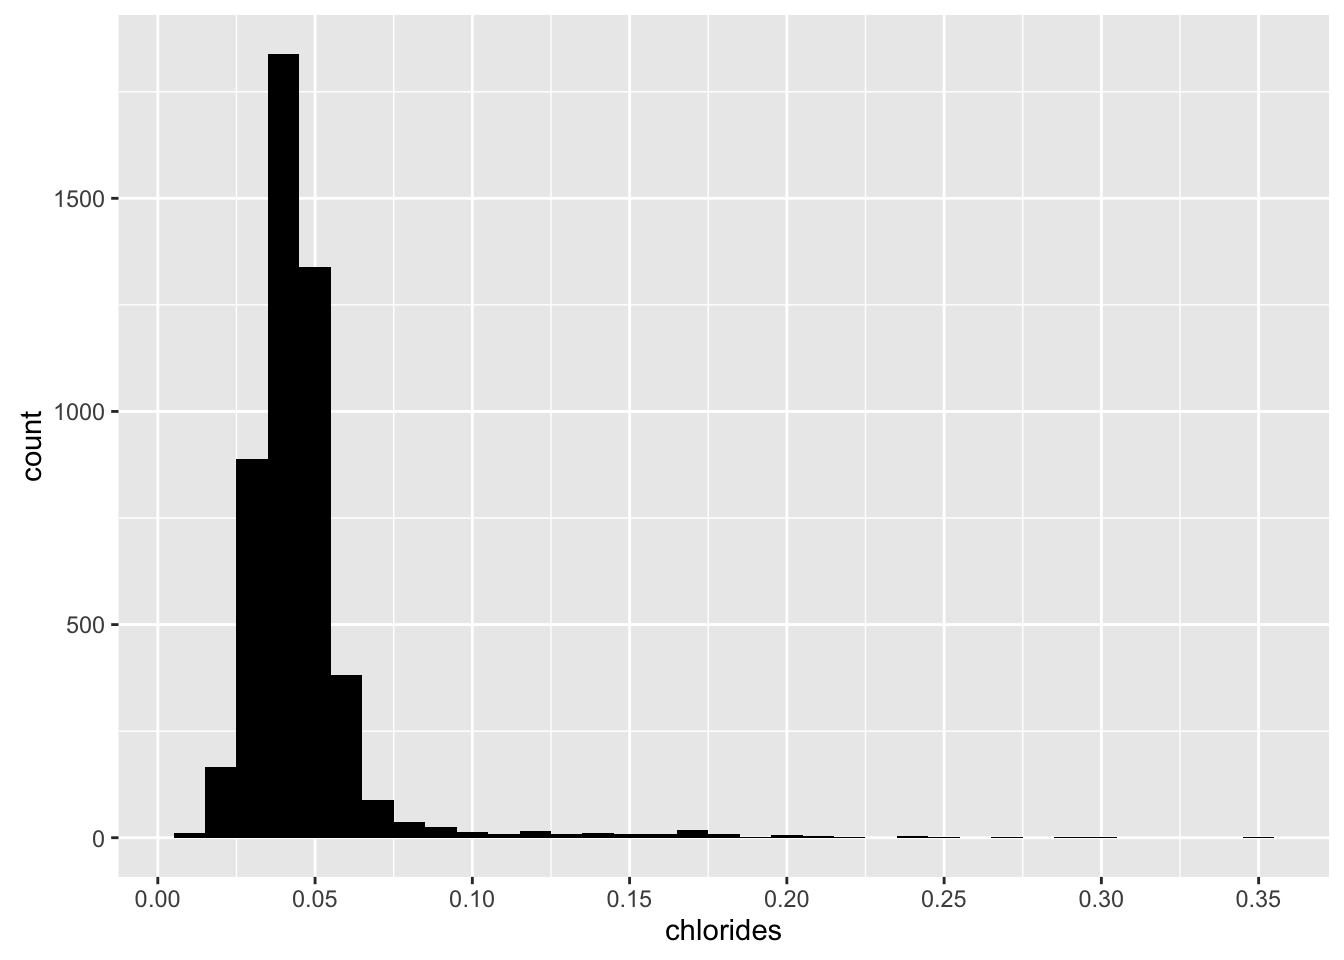
Chlorides seems normal distribution. Most white wines are 0.04 chlorides.
Free sulfur dioxide
##    Min. 1st Qu.  Median    Mean 3rd Qu.    Max.
##    2.00   23.00   34.00   35.31   46.00  289.00
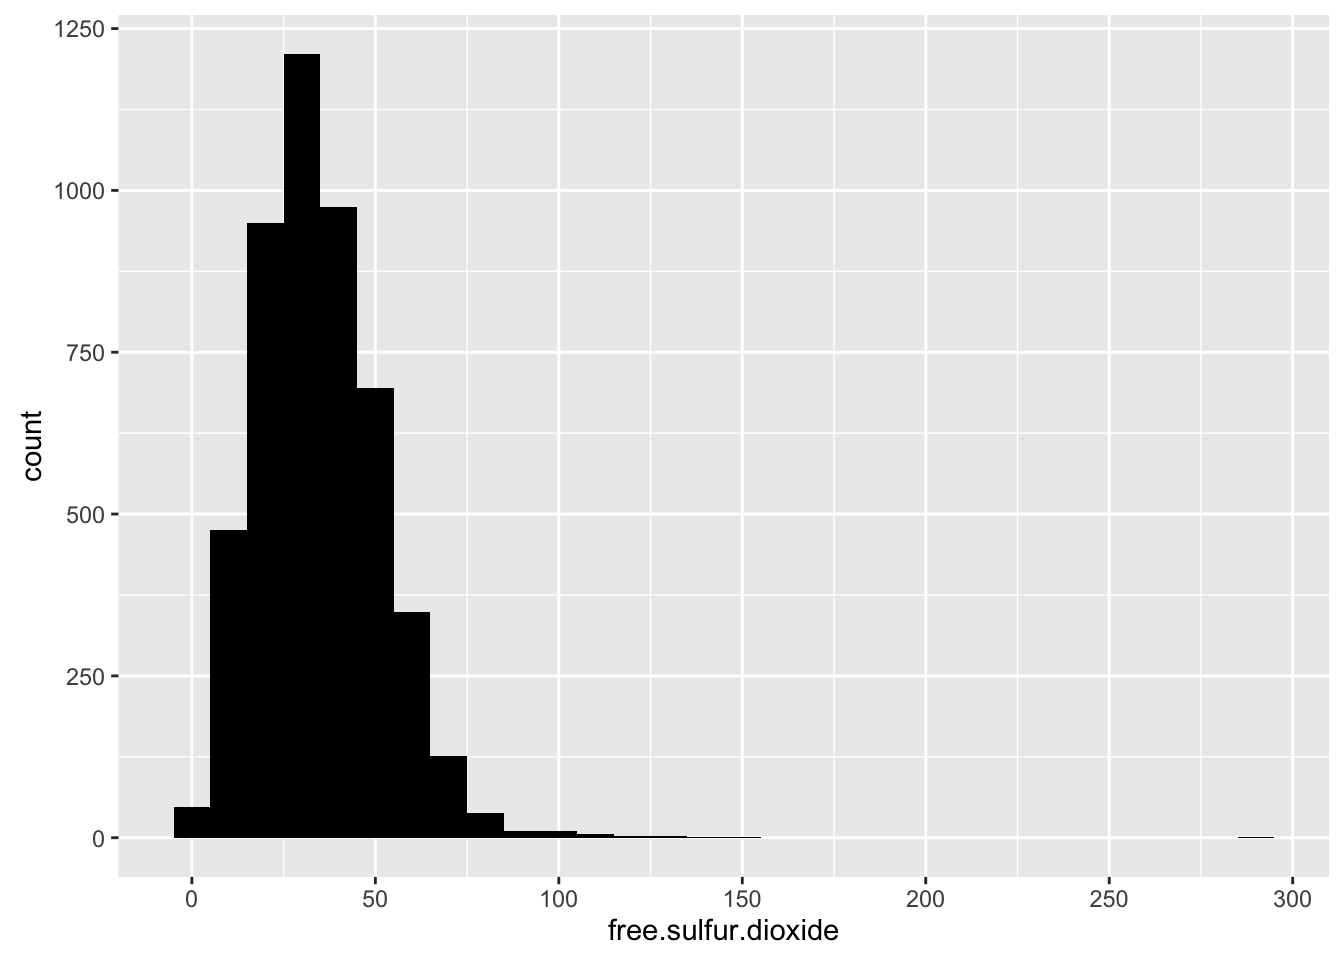
Free sulfur dioxide seems normal distribution. Most white wines have 34 free sulfur dioxide.
Total sulfur dioxide
##    Min. 1st Qu.  Median    Mean 3rd Qu.    Max.
##     9.0   108.0   134.0   138.4   167.0   440.0
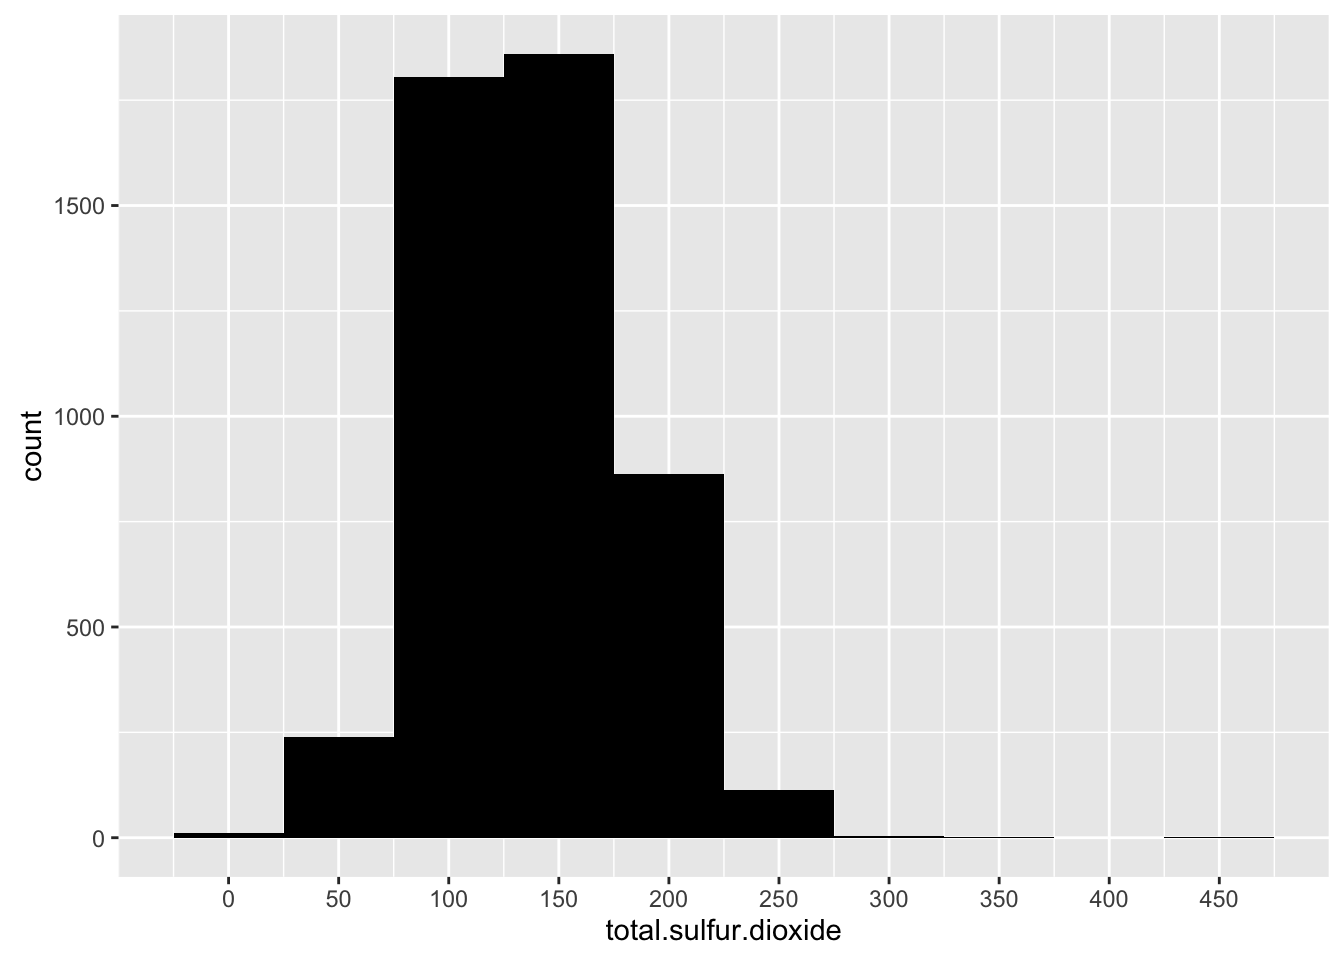
Total sulfur dioxide seems normal distribution. Most white wines have 130 total sulfur dioxide.
pH
##    Min. 1st Qu.  Median    Mean 3rd Qu.    Max.
##   2.720   3.090   3.180   3.188   3.280   3.820
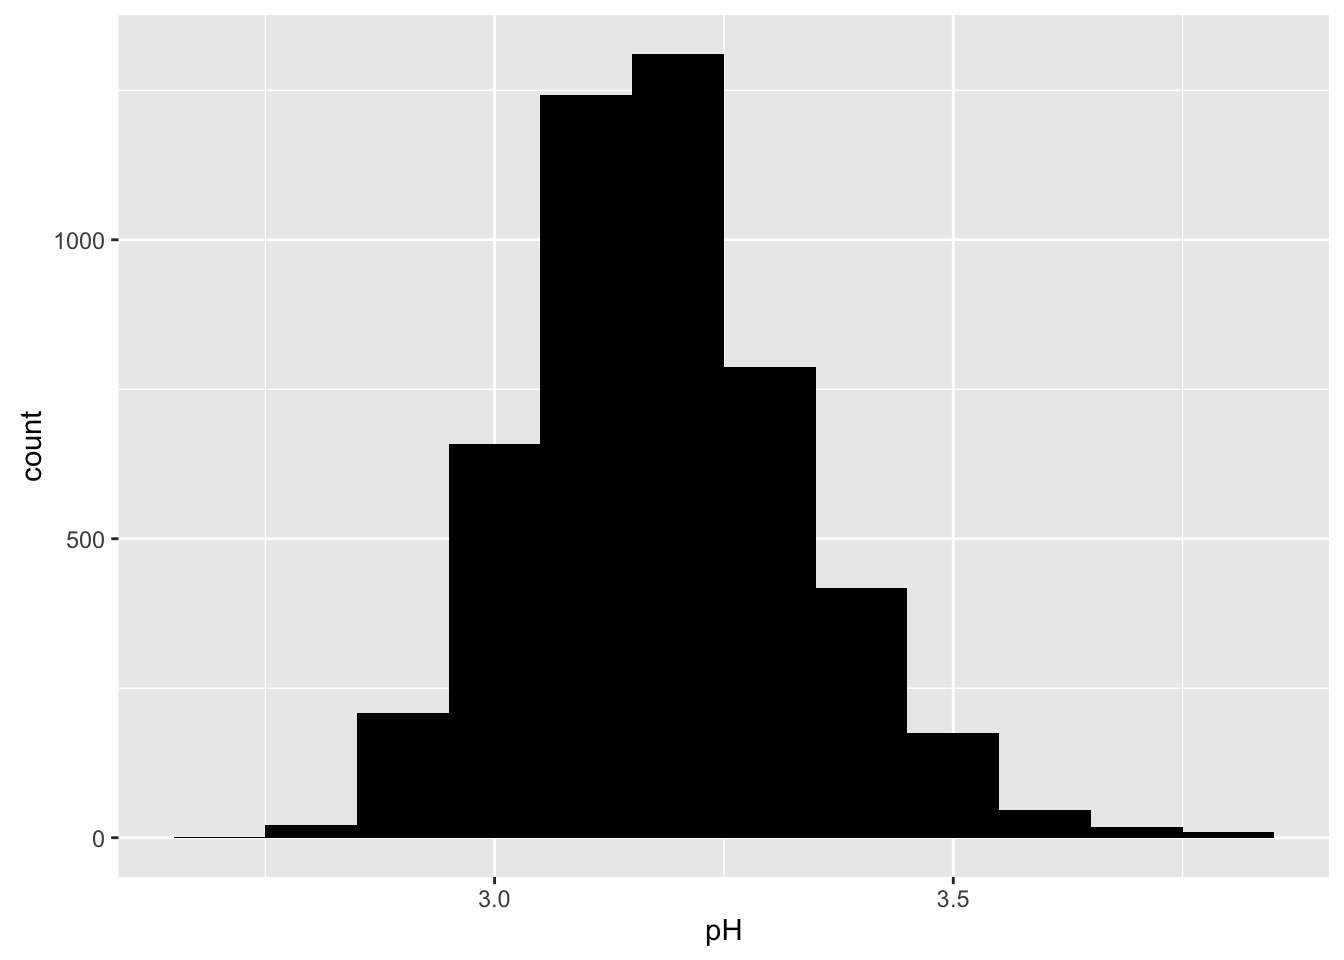
PH seems normal distribution. Most white wines have 3 pH.
Sulphates
##    Min. 1st Qu.  Median    Mean 3rd Qu.    Max.
##  0.2200  0.4100  0.4700  0.4898  0.5500  1.0800
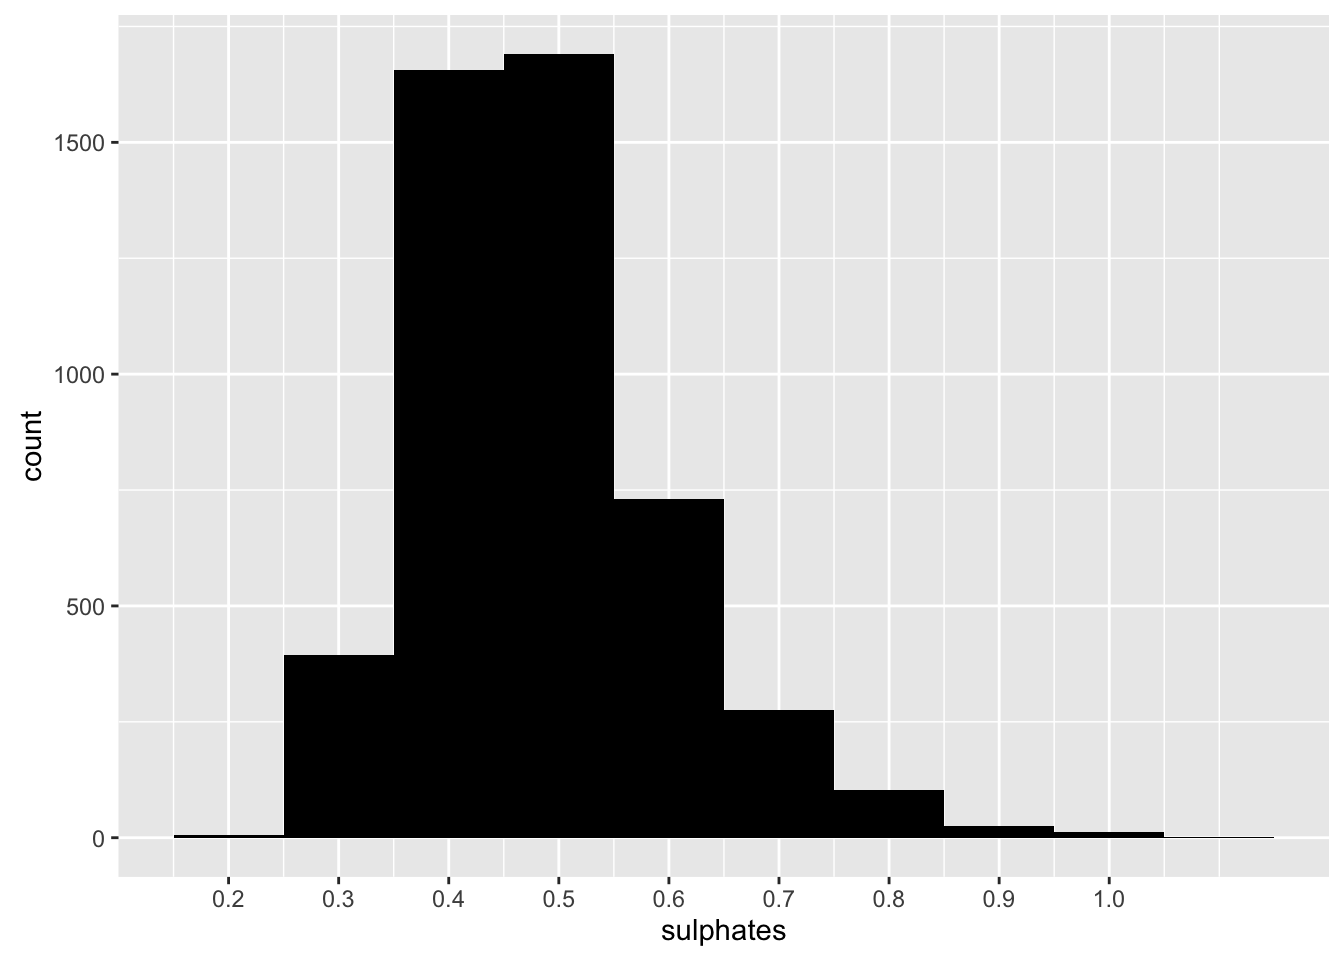
Sulphates seems normal distribution. Most white wines have 0.5 sulphates.
Did you create any new variables from existing variables in the dataset?
##    3    4    5    6    7    8    9
##   20  163 1457 2198  880  175    5
I created a “quality.factor” variable. The quality is based on sensory data of wine experts, and it is between 0 (very bad) and 10 (very excellent). So, I factorize the quality to make easy to see the frequency of quality. In variable description, experts grade quality between 0 and 10, but it seems that extreme quality of wine is very rare. Most of wine are graded as normal.
Of the features you investigated, were there any unusual distributions? Did you perform any operations on the data to tidy, adjust, or change the form of the data? If so, why did you do this?
Residual sugar
##    Min. 1st Qu.  Median    Mean 3rd Qu.    Max.
##   0.600   1.700   5.200   6.391   9.900  65.800
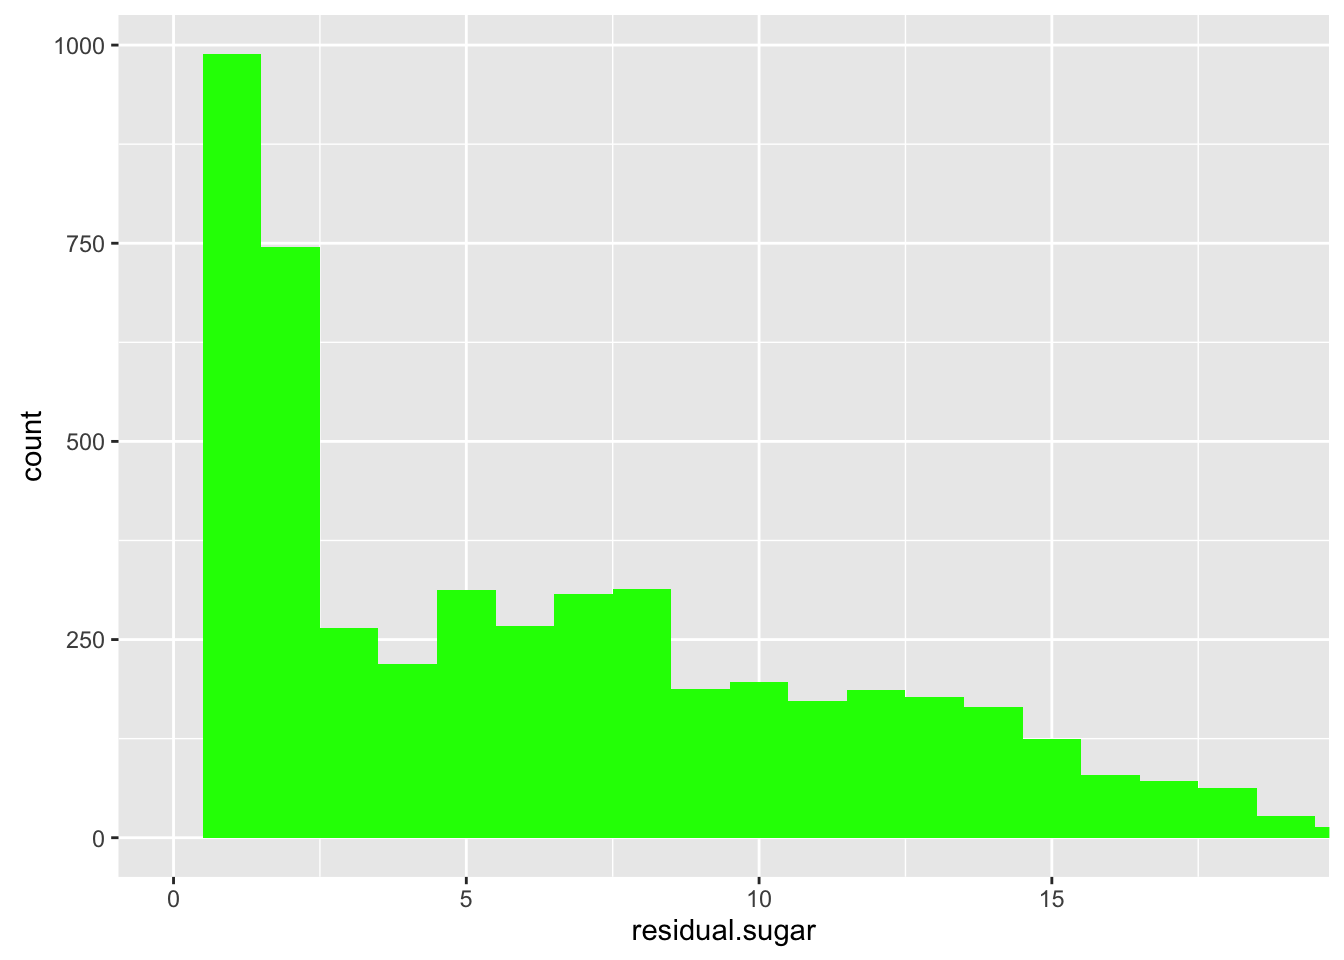
There is outlier of 65.8 (g/dm^3) and dataset shows very sweet wine is rare. So, I adjust breaks of x axis and plot without top 1% of residual sugar.
Bivariate Analysis
Talk about some of the relationships you observed in this part of the investigation. How did the feature(s) of interest vary with other features in the dataset?
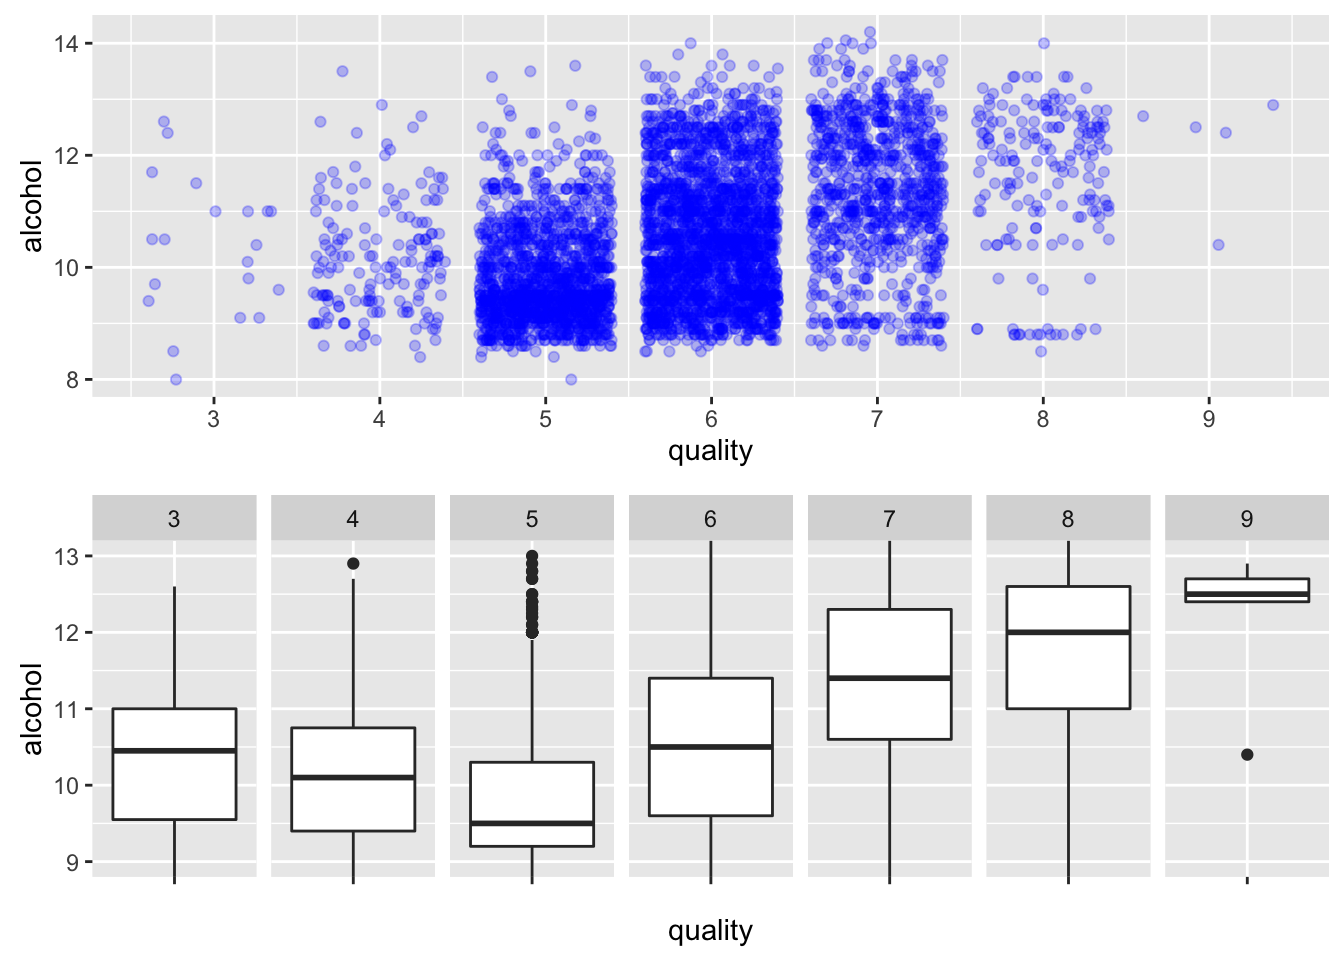
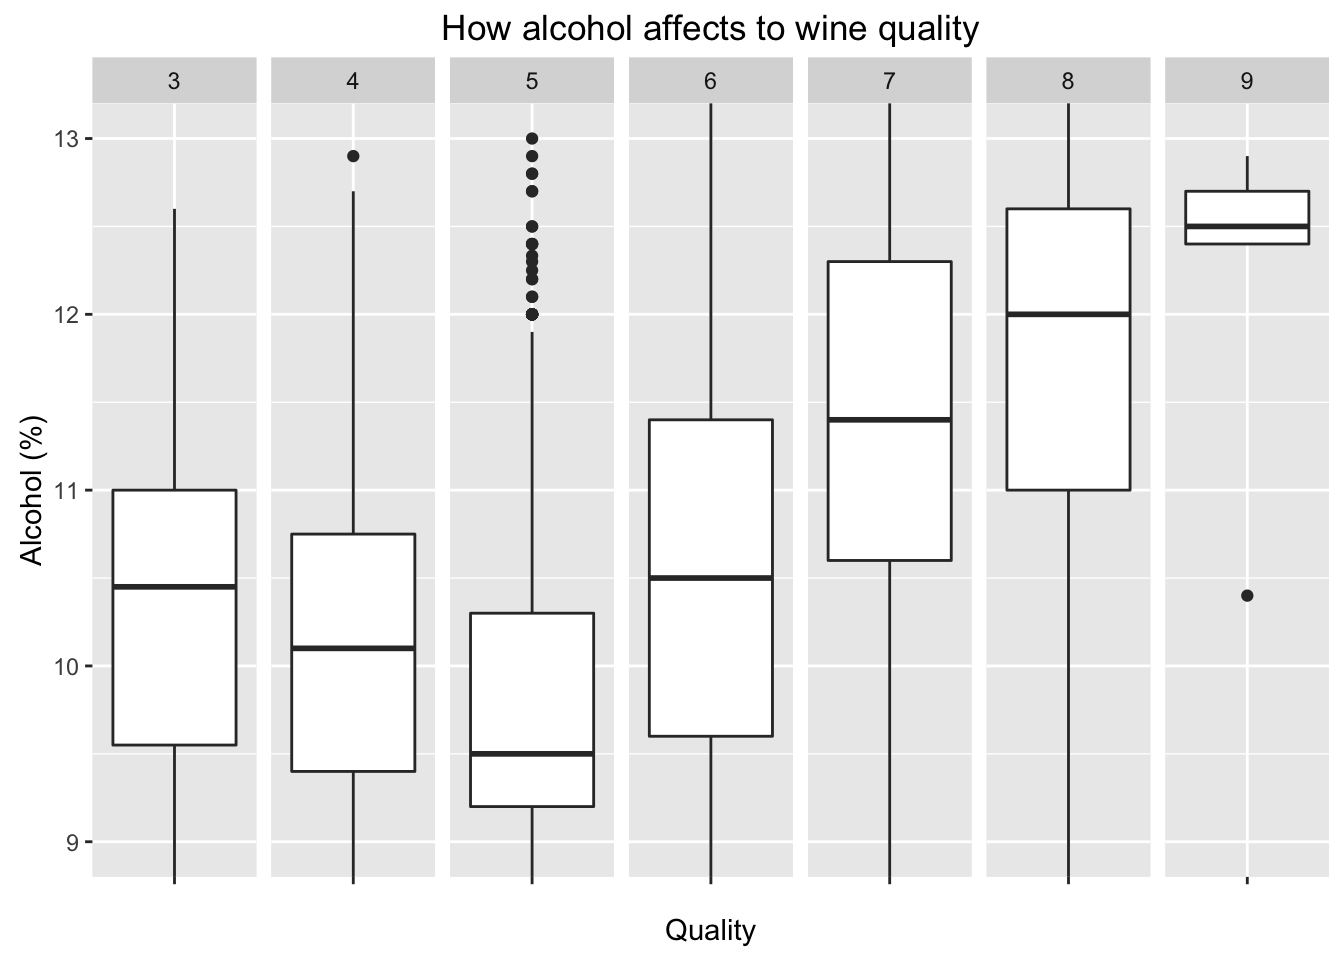
Quality by alcohol
    ##
    ##  Pearson's product-moment correlation
    ##
    ## data:  wine$quality and wine$alcohol
    ## t = 33.858, df = 4896, p-value < 2.2e-16
    ## alternative hypothesis: true correlation is not equal to 0
    ## 95 percent confidence interval:
    ##  0.4126015 0.4579941
    ## sample estimates:
    ##       cor
    ## 0.4355747
Level of alcohol is highly correlated to quality. High quality wine tends to have more alcohol.
Quality by Residual sugar & Quality by Ctric acid
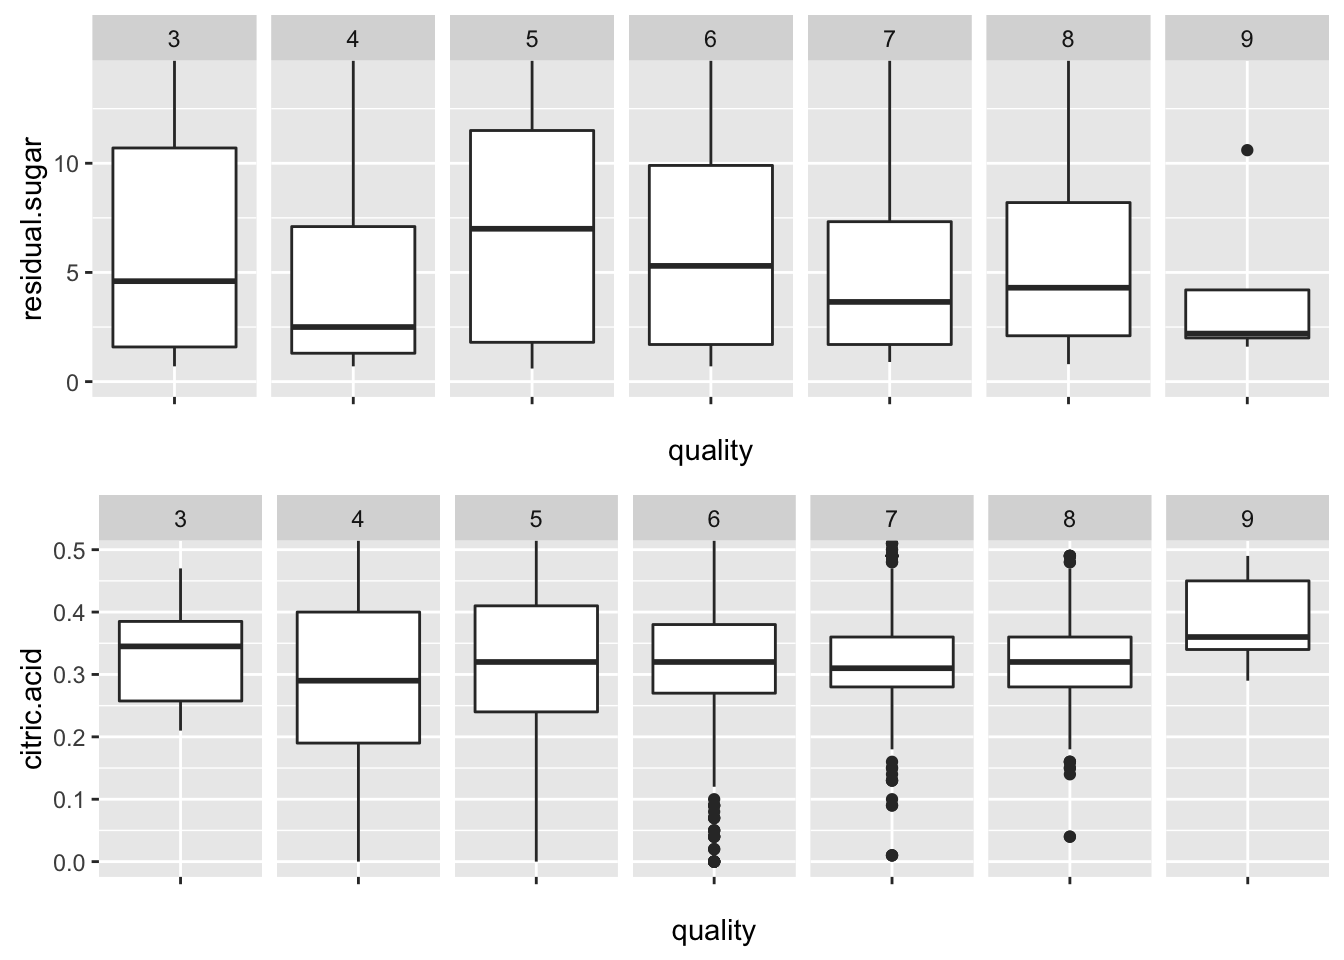
These are quite interesting relationships. Above quality 5, it seems ratio of residual sugar and citric acid is important. High quality of wine tends to crisp and dry.
Did you observe any interesting relationships between the other features (not the main feature(s) of interest)?
##
## Pearson's product-moment correlation
##
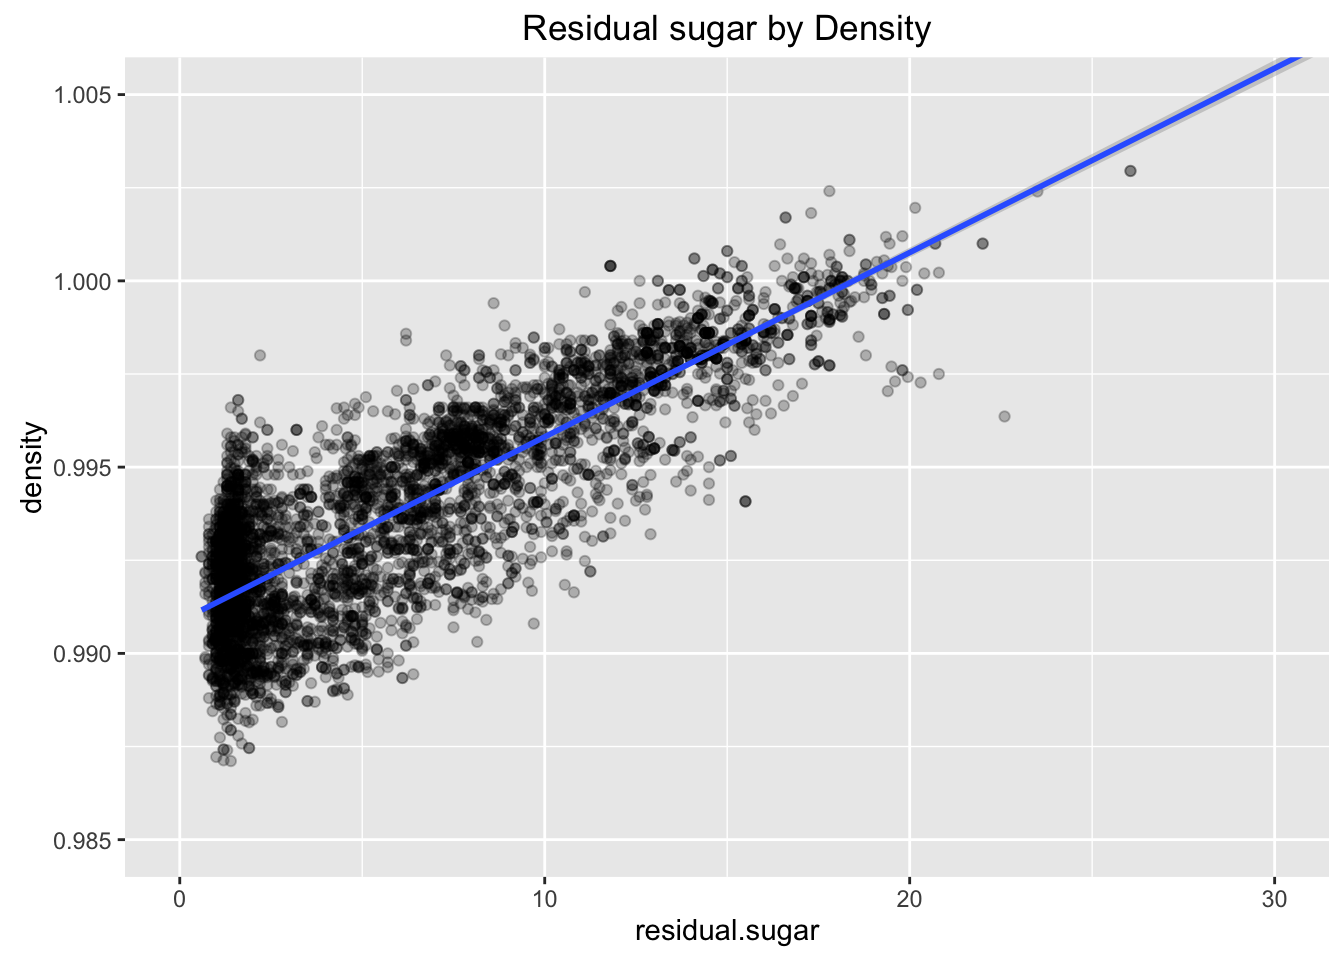
## data: wine$residual.sugar and wine$density
## t = 107.87, df = 4896, p-value < 2.2e-16
## alternative hypothesis: true correlation is not equal to 0
## 95 percent confidence interval:
## 0.8304732 0.8470698
## sample estimates:
## cor
## 0.8389665
##
## Pearson's product-moment correlation
##
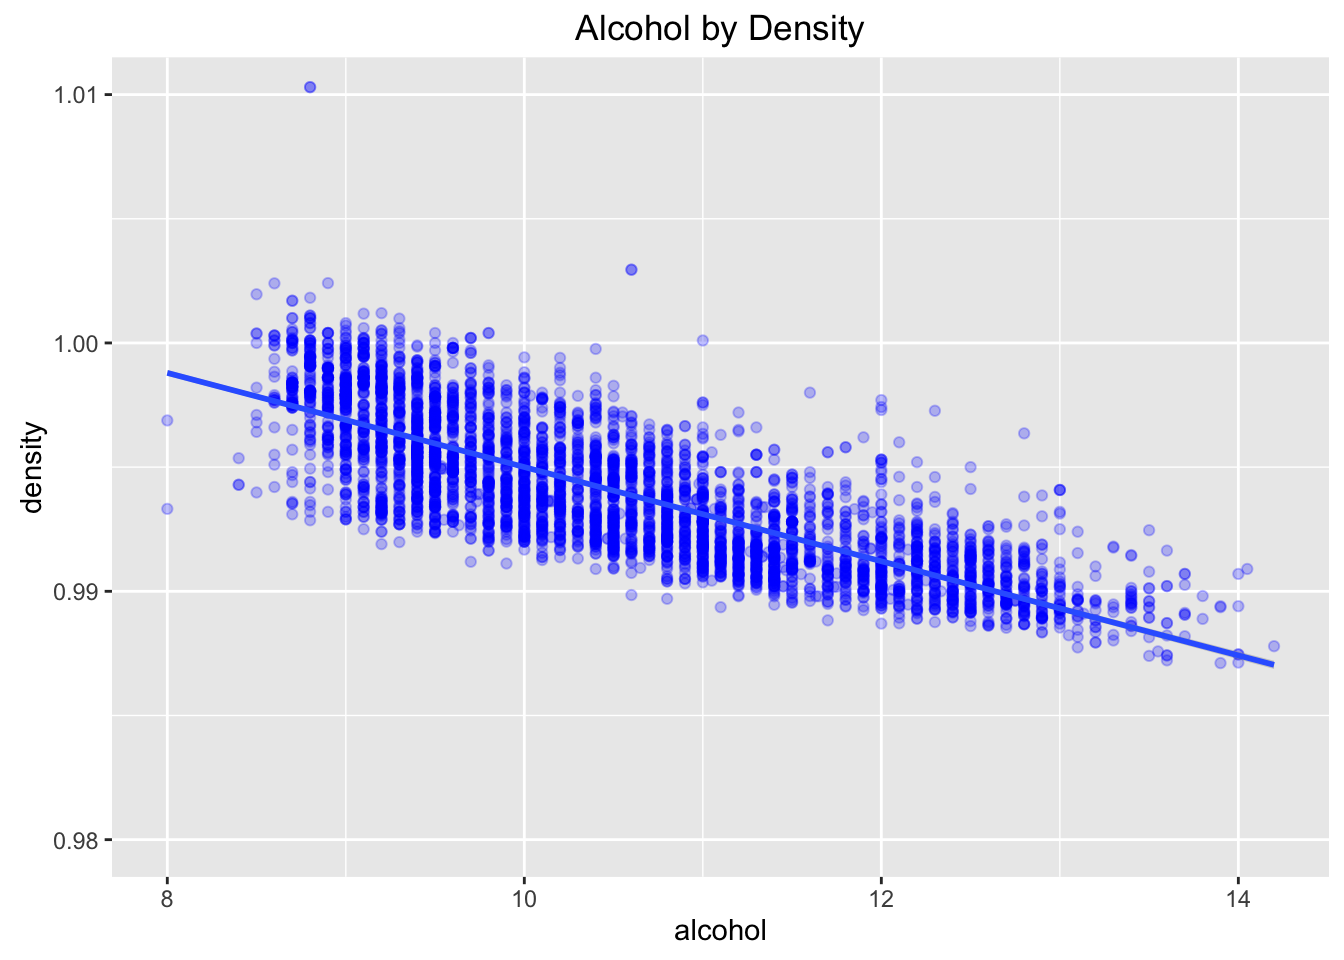
## data: wine$alcohol and wine$density
## t = -87.255, df = 4896, p-value < 2.2e-16
## alternative hypothesis: true correlation is not equal to 0
## 95 percent confidence interval:
## -0.7908646 -0.7689315
## sample estimates:
## cor
## -0.7801376
Other interesting relationships are residual sugar by density and alcohol by density. As amount of residual sugar is larger, the density gets higher. On the other hand, higher alcohol tends to lower density.
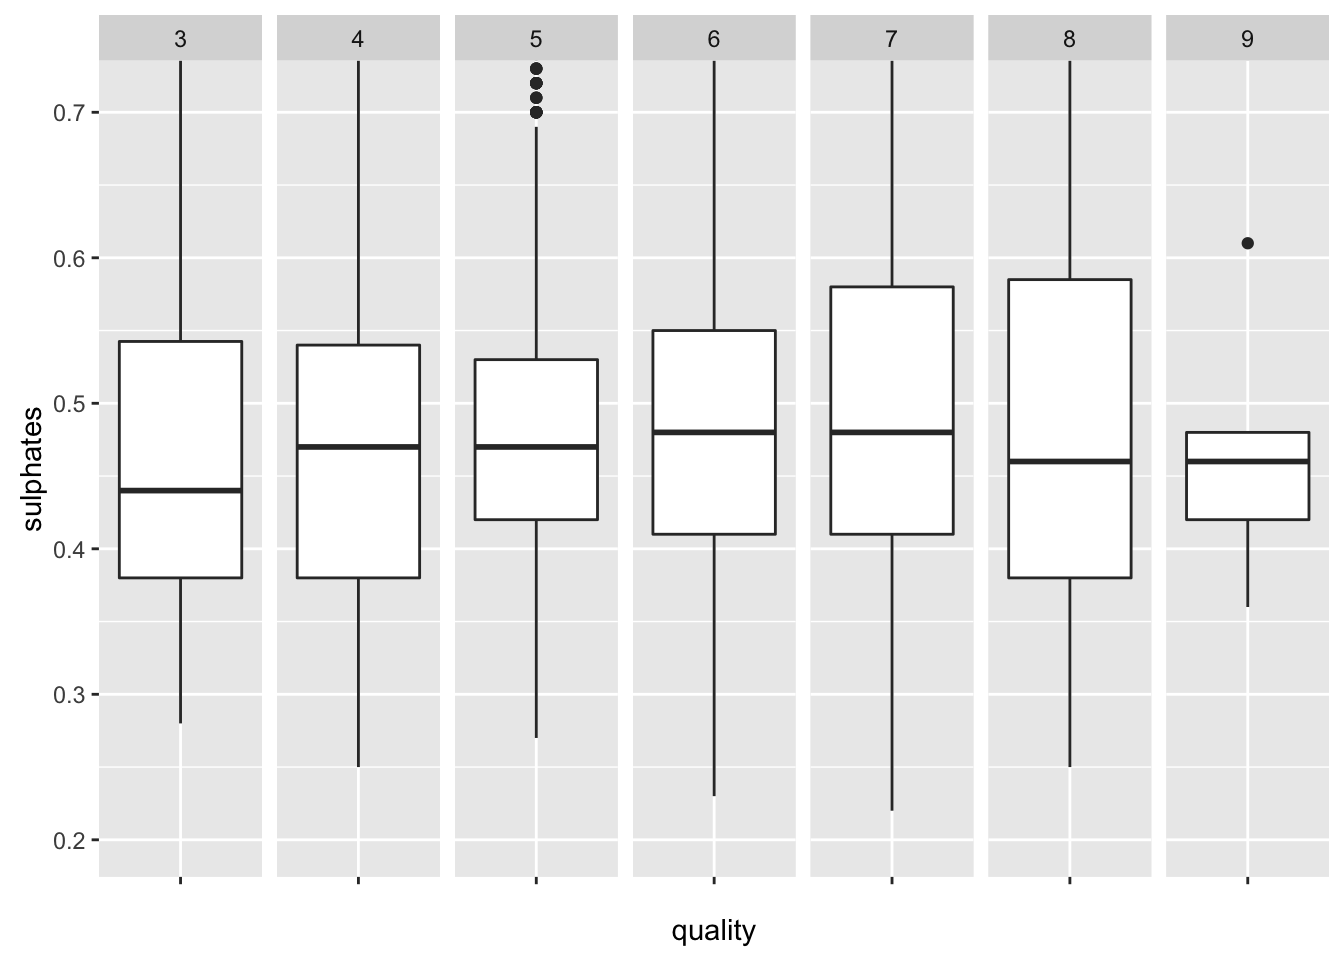
Because sulphates is related to fermenting nutrition of wine, I try to find relationship the sulphates and the quality. But, it was not clear to tell correlation of the two variables.
What was the strongest relationship you found?
I used ggpairs to find the strongest relationship, and residual sugar and density is the one. Correlation coefficient of two variables is quite large (0.838).
Multivariate Analysis
Talk about some of the relationships you observed in this part of the investigation. Were there features that strengthened each other in terms of looking at your feature(s) of interest?
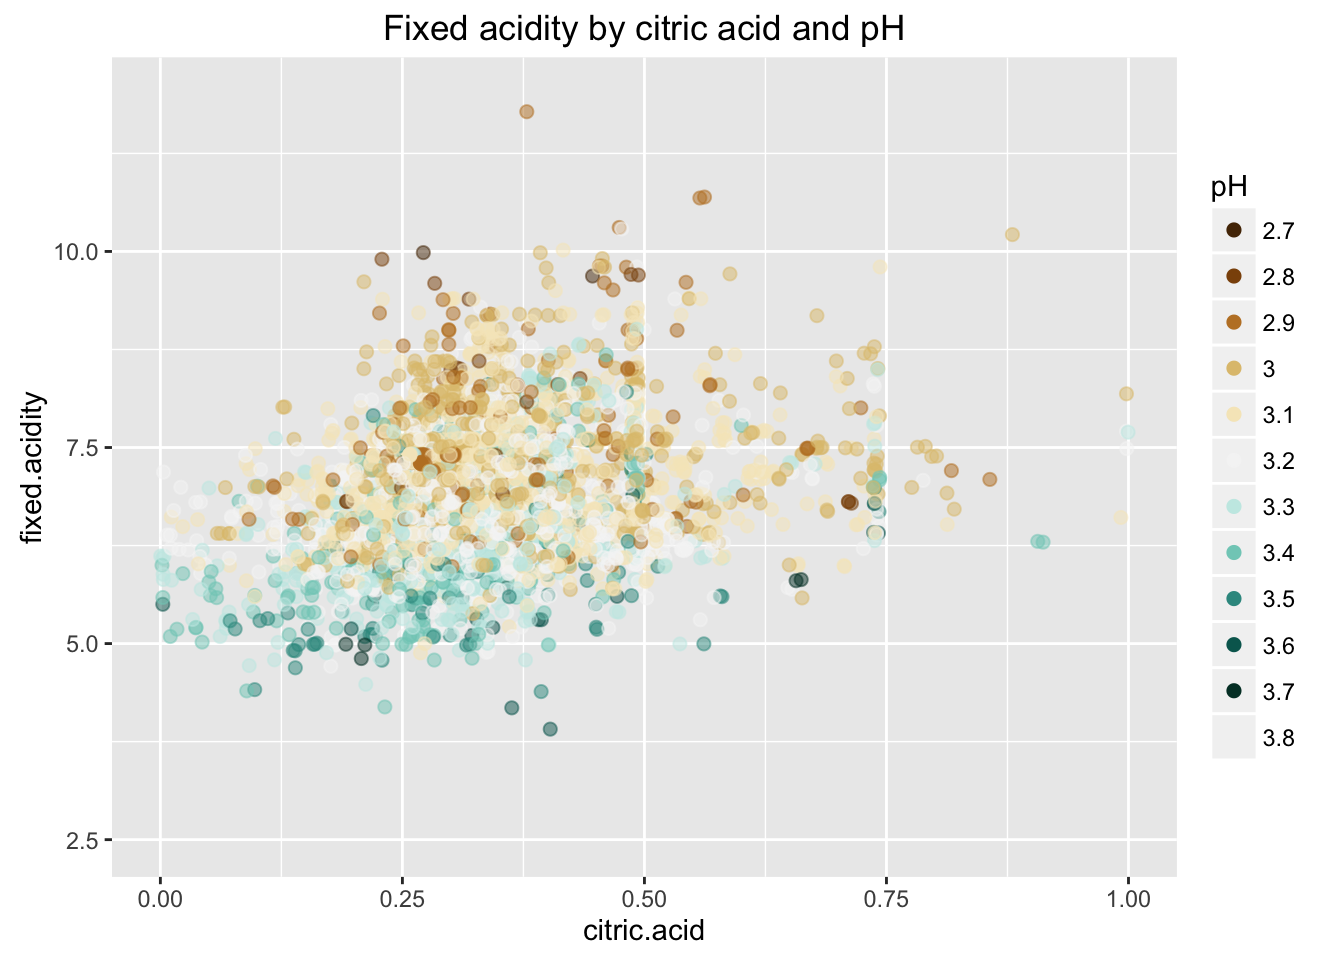
The pH indicates how acid or alkaline the wine is. Citric acid and fixed acidity strengthed pH variable. Among all variables, fixed acidity has largest correlation (-0.43) with pH.
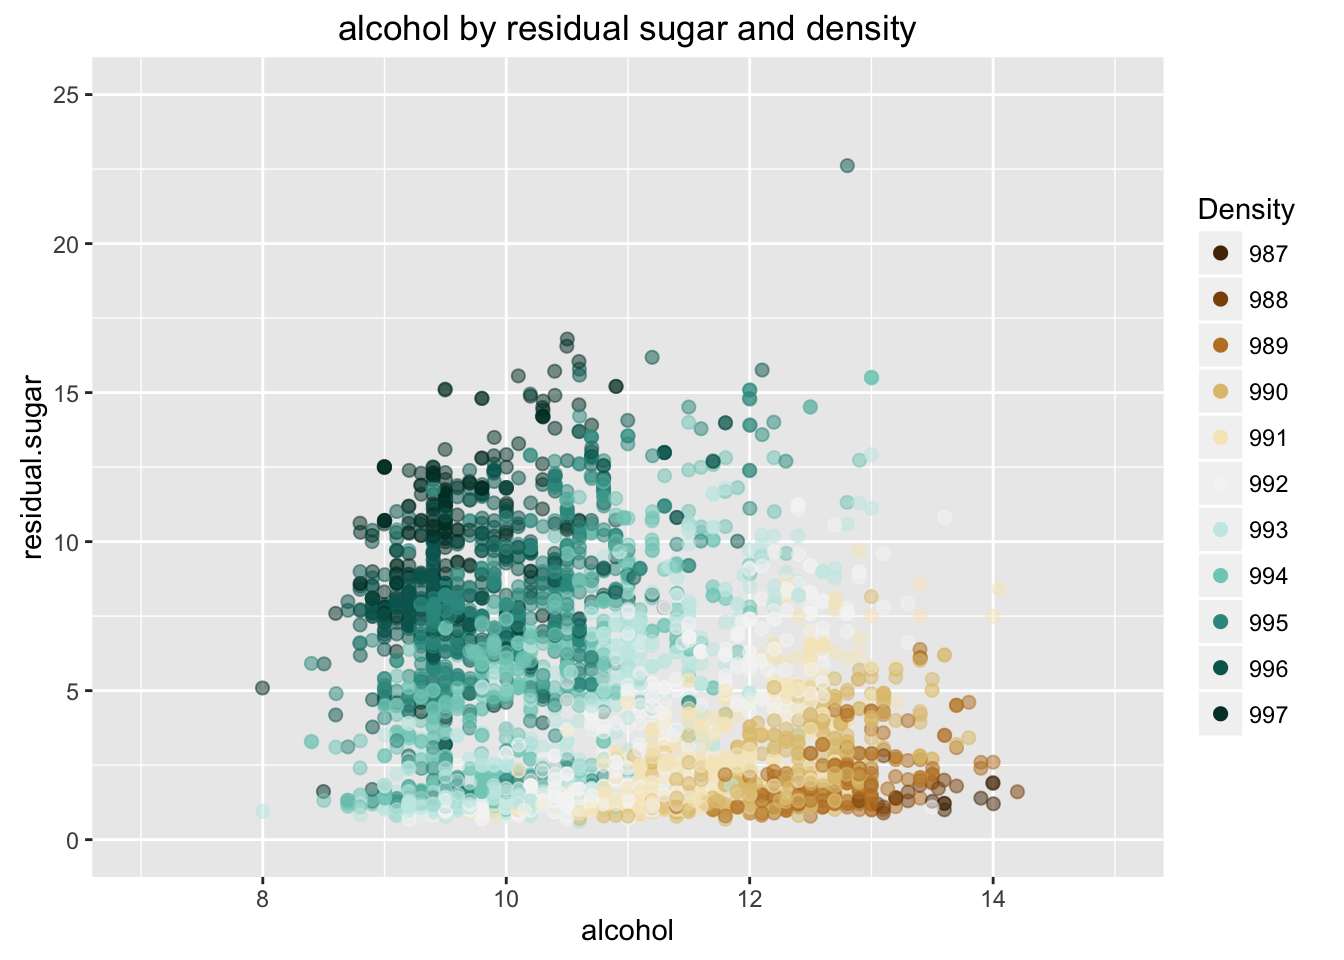
The density tends to smaller when alcohol level is high and residual sugar is low. It make sense when I think about strong alcohol drinks, such as whiskey. On the other hand, wine is thicker when alcohol is low and residual sugar is high. This plot is tidy to present relationships of three variable.
Were there any interesting or surprising interactions between features?

Since large number of wine are 5~6 grades, I facetted by quality to show clearer relationship between residual sugar and citirc acid. As a result, I can see that higher quality wine is less sweet. In addition, color pattern of alcohol is identified: high level of alcohol indicates high quality of wine.
Final Plots and Summary
Plot One
Description One
The most interesting feature is quality, because it tells about which wine is bad or excellent. The quality is normal distribution as shown in histogram.
Plot Two
Description Two
Level of alcohol is highly correlated to quality. High quality wine tends to have more alcohol.
Plot Three
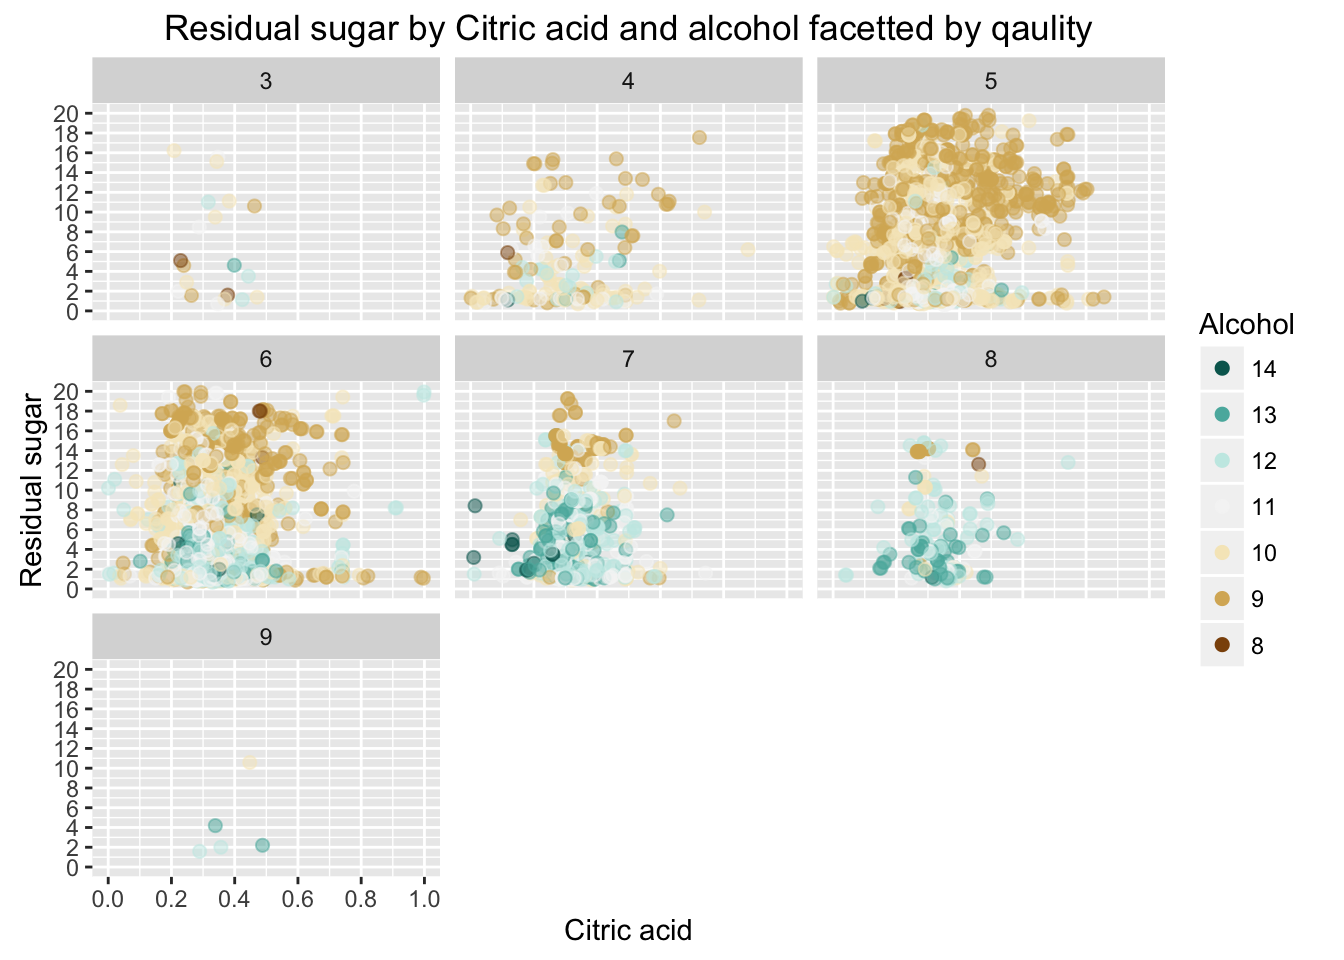
Description Three
Qaulity of white wines is decided by sensory data of wine experts. And Specific combinations of physicochemical factors affect the senses. For example, a good white wine has a crisp dry taste, which is attributed to citric acid and residual sugar in the wine. In this plot, I can see that higher quality wine is less sweet. In addition, color pattern of alcohol is identified: high level of alcohol indicates high quality of wine.
Reflection
Some variables were interesting factors since they influence to wine quality. I could explore white wine data set with various analysis and plots. In the bivariate analysis, alcohol shows clear positive relationship with quality. The strongest relationship was between residual sugar and density. Through the multivariate analysis, I checked citric acid, residual sugar, and alcohol are key factor to define wine quality. At first, it was difficult to choose variables that influence the quality. I had to explore each variable one at a time, and find the meaning of physicochemical features. Also, I realize that background knowledge about white wine could be helpful to select more interesting variables.
Cortez et al. concluded that the most intriguing result is the high importance of sulphates. An increase in sulphates might be related to the fermenting nutrition, which is very important to improve the wine aroma. However, I had a difficulty to find such a relationship bewteen sulphates and quality. I confirmed high qaulity wines tends to show denser distribution of sulphates, but I’m not sure there is a certain linear relationship.
In addition, I think variable related to time might help to predict wine quality. Taste of wine changes over time, and aged wine has higher quality.
[Cortez et al., 2009] P. Cortez, A. Cerdeira, F. Almeida, T. Matos and J. Reis., Modeling wine preferences by data mining from physicochemical properties., In Decision Support Systems, Elsevier, 47(4):547-553. ISSN: 0167-9236.