I investigated Titanic dataset using NumPy and Pandas. I went through the entire data analysis process, starting by posing a question and finishing by sharing my findings. In this report, the passengers survival rate is analyzed according to passenger class, age, and sex.
Questions
- Does pclass affect to survival rate?
- What age were more likely to survive?
- Does sex affect to survival rate?
Variables
- independent variables : Pclass, Age, Sex
- dependent variable : Survived
Reading Titanic data
%pylab inline
import seaborn as sns
import numpy as np
import pandas as pd

titanic_data_df = pd.read_csv('titanic_data.csv')
Populating the interactive namespace from numpy and matplotlib
Statistics of Titanic data
titanic_data_df.head()
| PassengerId | Survived | Pclass | Name | Sex | Age | SibSp | Parch | Ticket | Fare | Cabin | Embarked | |
|---|---|---|---|---|---|---|---|---|---|---|---|---|
| 0 | 1 | 0 | 3 | Braund, Mr. Owen Harris | male | 22 | 1 | 0 | A/5 21171 | 7.2500 | NaN | S |
| 1 | 2 | 1 | 1 | Cumings, Mrs. John Bradley (Florence Briggs Th... | female | 38 | 1 | 0 | PC 17599 | 71.2833 | C85 | C |
| 2 | 3 | 1 | 3 | Heikkinen, Miss. Laina | female | 26 | 0 | 0 | STON/O2. 3101282 | 7.9250 | NaN | S |
| 3 | 4 | 1 | 1 | Futrelle, Mrs. Jacques Heath (Lily May Peel) | female | 35 | 1 | 0 | 113803 | 53.1000 | C123 | S |
| 4 | 5 | 0 | 3 | Allen, Mr. William Henry | male | 35 | 0 | 0 | 373450 | 8.0500 | NaN | S |
print 'Total number of passengers :', titanic_data_df['PassengerId'].count()
print 'Total number of male/female :', titanic_data_df.groupby('Sex').count()['PassengerId']['male'], '/', titanic_data_df.groupby('Sex').count()['PassengerId']['female']
print 'Statistics: '
print titanic_data_df.describe()
Total number of passengers : 891
Total number of male/female : 577 / 314
Statistics:
       PassengerId    Survived      Pclass         Age       SibSp  \
count   891.000000  891.000000  891.000000  714.000000  891.000000
mean    446.000000    0.383838    2.308642   29.699118    0.523008
std     257.353842    0.486592    0.836071   14.526497    1.102743
min       1.000000    0.000000    1.000000    0.420000    0.000000
25%     223.500000    0.000000    2.000000   20.125000    0.000000
50%     446.000000    0.000000    3.000000   28.000000    0.000000
75%     668.500000    1.000000    3.000000   38.000000    1.000000
max     891.000000    1.000000    3.000000   80.000000    8.000000

            Parch        Fare
count  891.000000  891.000000
mean     0.381594   32.204208
std      0.806057   49.693429
min      0.000000    0.000000
25%      0.000000    7.910400
50%      0.000000   14.454200
75%      0.000000   31.000000
max      6.000000  512.329200
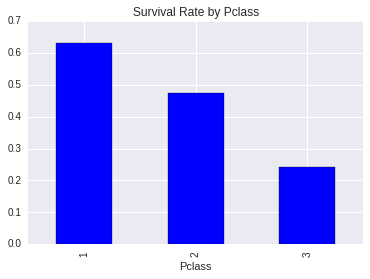
Does pclass affect to survival rate?
survived_passengers_by_class = titanic_data_df.groupby('Pclass').sum()['Survived']
passengers_by_class = titanic_data_df.groupby('Pclass').count()['PassengerId']

def survived_percentage(passengers, survived):
    return survived / passengers


survived_passengers =  survived_percentage(passengers_by_class, survived_passengers_by_class)

survived_passengers.plot(kind='bar', title='Survival Rate by Pclass')
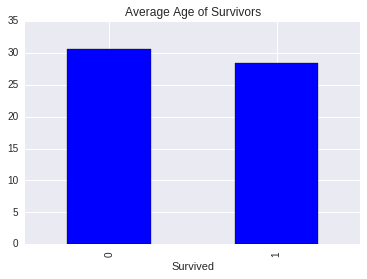
What age were more likely to survive?
def correlation(x, y):
    std_x = (x - x.mean()) / x.std(ddof=0)
    std_y = (y - y.mean()) / y.std(ddof=0)

    return (std_x * std_y).mean()

print 'Pearson\'s r:', correlation(titanic_data_df['Survived'], titanic_data_df['Age'])
print 'Age and Survival have negative correlation. Younger passengers were more likely to survive.'
print ' '

avg_age_by_survived = titanic_data_df.groupby('Survived').mean()['Age']
avg_age_by_survived.plot(kind='bar', title='Average Age of Survivors')
Pearson's r: -0.0779826784139
Age and Survival have negative correlation. Younger passengers were more likely to survive.
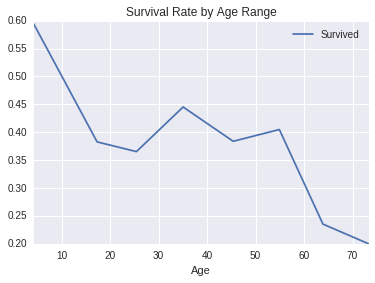
ranged_age_of_survivors = titanic_data_df.groupby(pd.cut(titanic_data_df['Age'], np.arange(0, 90, 10))).mean()
print 'Titanic data with age range (pandas groupby range is refered http://stackoverflow.com/questions/21441259/pandas-groupby-range-of-values)'
ranged_age_of_survivors
Titanic data with age range (pandas groupby range is refered http://stackoverflow.com/questions/21441259/pandas-groupby-range-of-values)
| PassengerId | Survived | Pclass | Age | SibSp | Parch | Fare | |
|---|---|---|---|---|---|---|---|
| Age | |||||||
| (0, 10] | 430.843750 | 0.593750 | 2.640625 | 4.268281 | 1.843750 | 1.421875 | 30.434439 |
| (10, 20] | 447.660870 | 0.382609 | 2.530435 | 17.317391 | 0.591304 | 0.391304 | 29.529531 |
| (20, 30] | 428.682609 | 0.365217 | 2.386957 | 25.423913 | 0.321739 | 0.239130 | 28.306719 |
| (30, 40] | 468.690323 | 0.445161 | 2.090323 | 35.051613 | 0.374194 | 0.393548 | 42.496100 |
| (40, 50] | 483.500000 | 0.383721 | 1.918605 | 45.372093 | 0.372093 | 0.430233 | 41.163181 |
| (50, 60] | 449.809524 | 0.404762 | 1.523810 | 54.892857 | 0.309524 | 0.309524 | 44.774802 |
| (60, 70] | 430.882353 | 0.235294 | 1.529412 | 63.882353 | 0.176471 | 0.352941 | 45.910782 |
| (70, 80] | 438.200000 | 0.200000 | 1.800000 | 73.300000 | 0.000000 | 0.000000 | 25.936680 |
ranged_age_of_survivors.plot(kind='line', x='Age', y='Survived', title='Survival Rate by Age Range')
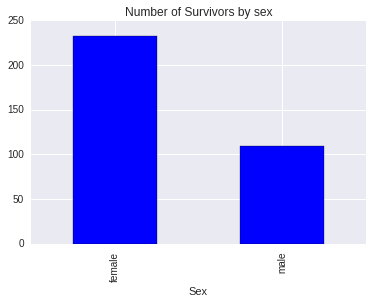
Does sex affect to survival rate?
survivors_by_sex = titanic_data_df.groupby('Sex').sum()['Survived']
print survivors_by_sex
survivors_by_sex.plot(kind='bar', title='Number of Survivors by sex')
Sex
female    233
male      109
Name: Survived, dtype: int64