A few researchers set out to determine the optimal length of chopsticks for children and adults. They came up with a measure of how effective a pair of chopsticks performed, called the “Food Pinching Performance”. It was determined by counting the number of peanuts picked and placed in a cup (PPPC).
The abstract below was adapted from here
Chopsticks are one of the most simple and popular hand tools ever invented by humans, but have not previously been investigated by ergonomists. Two laboratory studies were conducted in this research, using a randomised complete block design, to evaluate the effects of the length of the chopsticks on the food-serving performance of adults and children. Thirty-one male junior college students and 21 primary school pupils served as subjects for the experiment to test chopsticks lengths of 180, 210, 240, 270, 300, and 330 mm. The results showed that the food-pinching performance was significantly affected by the length of the chopsticks, and that chopsticks of about 240 and 180 mm long were optimal for adults and pupils, respectively. Based on these findings, the researchers suggested that families with children should provide both 240 and 180 mm long chopsticks. In addition, restaurants could provide 210 mm long chopsticks, considering the trade-offs between ergonomics and cost.
For the rest of this project, answer all questions based only on the part of the experiment analyzing the thirty-one adult male college students.
Download the data set for the adults, then answer the following questions based on the abstract and the data set.
Variables
What is the independent variable in the experiment?
Chopstick.Length
What is the dependent variable in the experiment?
Food.Pinching.Efficiency
How is the dependent variable operationally defined?
The “Food Pinching Performance” was determined by counting the number of peanuts picked and placed in a cup (PPPC).
Based on the description of the experiment and the data set, list at least two variables that you know were controlled.
Participant’s age, sex are controlled.
Basic statistics
One great advantage of ipython notebooks is that you can document your data analysis using code, add comments to the code, or even add blocks of text using Markdown. These notebooks allow you to collaborate with others and share your work. For now, let’s see some code for doing statistics.
import pandas as pd
path = r'~/Downloads/chopstick-effectiveness.csv'
dataFrame = pd.read_csv(path)
Let’s do a basic statistical calculation on the data using code! Run the block of code below to calculate the average “Food Pinching Efficiency” for all 31 participants and all chopstick lengths.
dataFrame['Food.Pinching.Efficiency'].mean()
25.00559139784947
This number is helpful, but the number doesn’t let us know which of the chopstick lengths performed best for the thirty-one male junior college students. Let’s break down the data by chopstick length. The next block of code will generate the average “Food Pinching Effeciency” for each chopstick length. Run the block of code below.
meansByChopstickLength = dataFrame.groupby('Chopstick.Length')['Food.Pinching.Efficiency'].mean().reset_index()
meansByChopstickLength

# reset_index() changes Chopstick.Length from an index to column. Instead of the index being the length of the chopsticks, the index is the row numbers 0, 1, 2, 3, 4, 5.
Table 1: Mean Food.Pinching.Efficiency by Chopstic.Length
| Chopstick.Length | Food.Pinching.Efficiency | |
|---|---|---|
| 0 | 180 | 24.935161 |
| 1 | 210 | 25.483871 |
| 2 | 240 | 26.322903 |
| 3 | 270 | 24.323871 |
| 4 | 300 | 24.968065 |
| 5 | 330 | 23.999677 |
Which chopstick length performed the best for the group of thirty-one male junior college students?
# Causes plots to display within the notebook rather than in a new window
%pylab inline
import matplotlib.pyplot as plt
plt.scatter(x=meansByChopstickLength['Chopstick.Length'],
y=meansByChopstickLength['Food.Pinching.Efficiency'])
plt.xlabel("Length in mm")
plt.ylabel("Efficiency in PPPC")
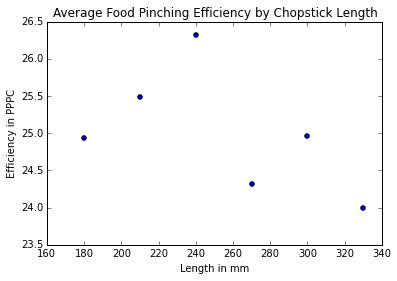
plt.title("Average Food Pinching Efficiency by Chopstick Length")
plt.show()
Analysis
Based on the scatterplot created from the code above, interpret the relationship you see. What do you notice?
Data clearly shows the most effective chopstick length is 240mm. With the scatterplot, I can easily figure out the second effective one.
In the abstract the researchers stated that their results showed food-pinching performance was significantly affected by the length of the chopsticks, and that chopsticks of about 240 mm long were optimal for adults. Based on the data you have analyzed, do you agree with the claim?
I agree with the claim.
Why?
Considering independent variable, and controlled variable, it is reasonable to claim that. However, I would add individual’s hand legnth because it can affect the length of the chopsticks.